EBRC Research Staff
Current data releases as of 4 October 2024
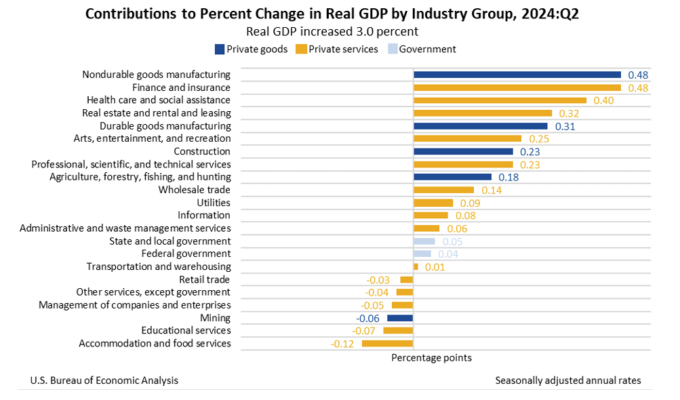
Real gross domestic product (GDP) increased at an annual rate of 3.0% in the second quarter of 2024, according to the third estimate released by the Bureau of Economic Analysis. In the first quarter, real GDP increased by 1.6% (revised). The increase in real GDP reflects upward revisions to private inventory investment and federal government spending that were offset by downward revisions to nonresidential fixed investment and exports. Imports, a subtraction to GDP, were revised up. Current-dollar GDP increased at an annual rate of 5.6% to $29.02 trillion. Real gross domestic income (GDP), an alternative method of calculating GDP, increased by 3.4% in the second quarter, an upward revision of 2.1 percentage points. Within private goods-producing industries, the leading contributors to GDP growth were nondurable goods manufacturing and durable goods manufacturing. The largest detractors from GDP were accommodation and food services, and educational services. – Delaney O’Kray-Murphy
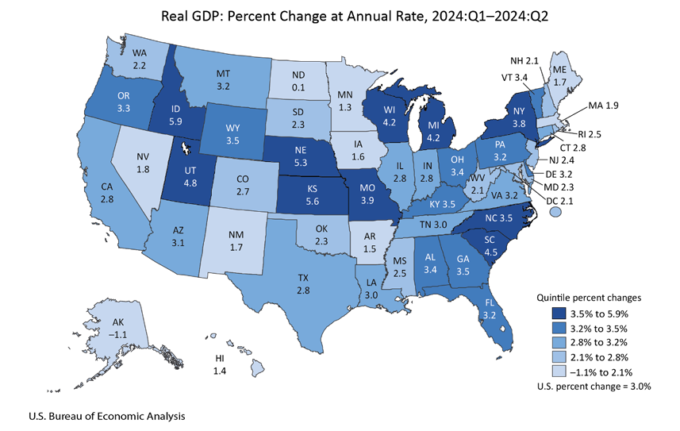
Nearly every state experienced gross domestic product (GDP) growth in the second quarter of 2024, with the national real GDP increasing at an annual rate of 3.0% for the same period. Alaska had a reduction of 1.1% for the quarter; however, the other 49 states and the District of Columbia had increases in real GDP, with Idaho leading with a 5.9% change. Arizona ranked near the middle, with 3.1% growth at an annual rate in the second quarter. Nondurable goods manufacturing, finance and insurance, and health care and social assistance were leading contributors to growth nationally. Finance and insurance also contributed to Arizona’s growth over the quarter as did durable goods manufacturing, though real estate and rental and leasing along with health care and social assistance were the most substantial influences. –Delaney O’Kray-Murphy and Valorie Rice
Arizona state personal income rose at an annual rate of 5.2% in the second quarter of 2024, just shy of the U.S. percent change of 5.3%. All 50 states and the District of Columbia experienced increased personal income for the quarter, ranging from 2.3% in North Dakota to 6.9% in South Carolina. Earnings, transfer receipts, and property income all contributed to the increase in personal income nationally with earnings and property income (dividends, interest, and rent) increasing in all 50 states and the District of Columbia. Transfer receipts increased in all but one state, Massachusetts, which had a 0.5% decrease. –Valorie Rice
U.S. nonfarm employment rose by 254,000 in September, more than the average monthly gain of 203,000 over the last year. The October 4 U.S. Employment Situation release indicated that July and August job numbers were revised upward adding a combined 72,000 to previously reported employment figures. Industries with notable employment gains for the month were food services and drinking places, health care, government, social assistance, and construction. There was little change for most other industries from one month to the next. The September unemployment rate for the nation ticked down to 4.1% from 4.2% in August but was higher than the same month a year ago when it recorded 3.8%. The labor force participation rate was 62.7% for the third consecutive month and has changed little over the year. –Valorie Rice
Phoenix house prices increased 2.9% over the year in July based on the most recent S&P CoreLogic Case-Shiller Indices. Nationally, house prices gained 5.0% in July while the 20-city composite had a 5.9% increase over the year. For the third consecutive month, New York had the highest increase in house prices over the year, at 8.8%, followed by Las Vegas at 8.2%. Portland remained at the low end among the 20 cities, with an annual increase of only 0.8%. All cities in the indices had price increases between May and June but eight experienced decreases between June and July. –Valorie Rice
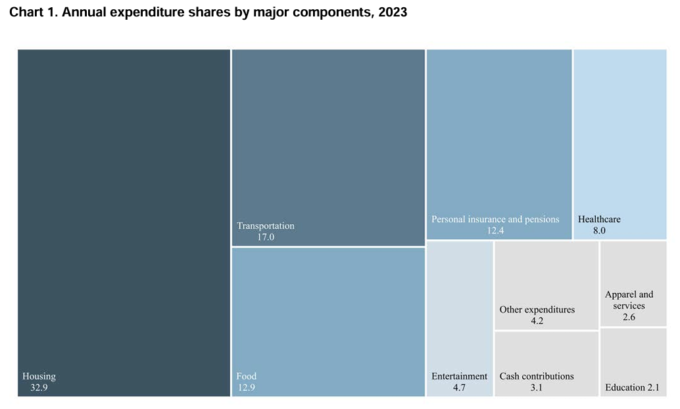
Average annual expenditures for all consumer units increased 5.9% in 2023, moving from $72,967 in 2022 to $77,280 in 2023 according to the September 25 U.S. Bureau of Labor Statistics release. Broken down by components, housing (32.9%) was the largest annual expenditure in 2023 followed by transportation (17.0%), food (12.9%), and personal insurance and pensions (12.4%). As a share of total expenditure categories, housing has gone down over the last four years while transportation has trended upward. Single parents and single people or other consumer units paid the largest percentage for housing, at 37.3% and 36.3%, respectively compared to 32.9% overall. The component with the largest percentage increase for the year was education, which rose 24.0%, while cash contributions decreased 13.7%. Tobacco products and smoking supplies also decreased, though slightly (-0.3%). Expenditures did not increase as much for those in the lower income quintiles, with those in the lowest three income brackets increasing less than the overall change of 5.9%. Those in the lowest income quintile had a 3.6% increase in annual expenditures and a 9.9% increase in income before taxes while those in the highest quintile had a 6.7% increase in expenditures and an 8.4% increase in income before taxes. The change in income for all consumer units was 8.3%. Consumer units consist of families, single people living alone or sharing a household but who are financially independent, or two or more persons living together and sharing major expenses. –Valorie Rice
In August, over the year metropolitan unemployment rates were higher in 315 of the 389 metropolitan areas, lower in 54 areas, and unchanged in the remaining 20. The August unemployment rate for the Tucson and Phoenix metropolitan areas came in at 3.9% and 3.5%, respectively. Yuma had the highest unemployment rate in Arizona at 16.3%, while Prescott ranked lowest, at 3.3%. Sioux Falls, SD, had the lowest unemployment rate out of all the metropolitan areas in the nation at 1.9%, and El Centro, CA, had the highest unemployment rate at 20.2%. The largest over-the-year increase occurred in Kokomo, IN (+6.5 percentage points), and Yuma, AZ, had the largest decrease over the year (-2.3 percentage points). – Delaney O’Kray-Murphy
The August 2024 release of the Job Openings and Labor Turnover (JOLTS) report stated that the number of job openings in the U.S. was 8.0 million. The job openings rate was 4.8% for the month. The industry with the largest increase was construction (+138,000). The sector with the largest decrease was other services (-93,000). Nationally, the number of hires was 5.3 million, with a rate of 3.3% for August and 3.4% for July. The number of total separations in the nation changed little, at 5.0 million (-317,000), with a rate of 3.1%. The number of quits trended down to 3.1 million (-159,000) with a rate of 1.9%. The number of layoffs and discharges changed little at 1.6 million and a rate of 1.0%. – Alex Jaeger
In August, Arizona over-the-year total building permits saw a slight -1.0% decrease to 4,919, not seasonally adjusted. The number of single-family permits similarly declined 8.7% over the year to 3,302. The Phoenix metro area accounted for most of the permits in the state with 3,759, which was unchanged. The number of permits in Tucson decreased 9.1% to 461. Of the counties, Gila, La Paz, Mohave, and Yavapai all saw increases, while Apache, Cochise, Coconino, Graham, Navajo, Pima, Santa Cruz, Pinal, and Yuma all saw decreases. No changes were observed in Greenlee and Maricopa. – Delaney O’Kray-Murphy


