Jennifer Pullen, EBRC senior research economist
In the first quarter, 46.8% of homes sold in Tucson were affordable
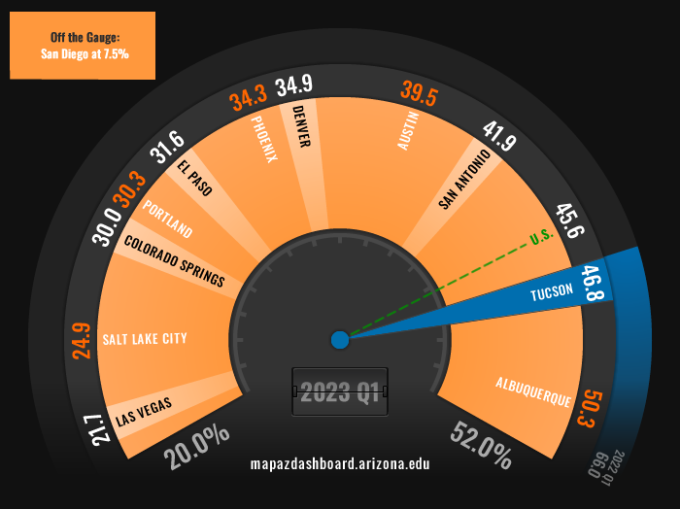
Housing affordability improved in the first quarter of 2023 for the Tucson Metropolitan Statistical Area (MSA) and many of its peers. Tucson ranked second, just behind Albuquerque, with 46.8% of homes sold in the first quarter of 2023 considered affordable to a family earning the local median income (Figure 1). That was an 11.8 percentage point increase from the record low of 35.0% in the fourth quarter of 2022. The improvement in housing affordability was driven primarily by a decline in the median price of homes sold during the first quarter of 2023 and a modest increase in median family income. Despite the improvement in early 2023, Tucson’s housing affordability remained nearly 20 percentage points lower than a year ago. Albuquerque posted the highest percentage of affordable homes at 50.3%, while San Diego had the lowest at 7.5%.
Figure 1: Housing Affordability (2023 Quarter 1)
Housing affordability across all MSAs tracked on the MAP improved during the first quarter of 2023. Austin posted the largest improvement increasing by 18.1 percentage points from a low of 21.4% in the fourth quarter of 2022 to 39.5% in the first quarter of 2023. Tucson fell in the middle of its peer MSAs with an improvement of 11.8 percentage points. Las Vegas posted the smallest improvement, increasing by only 4.5 percentage points between the fourth quarter of 2022 and the first quarter of 2023.
Housing affordability is an important issue for many households. Access to affordable housing is important because the home is the largest asset for most people, and its price can affect spending in other areas such as childcare, education, health care, and leisure activities. Since personal consumption makes up the better part of the economy, and discretionary income levels are influenced by the cost of housing, home prices are an important factor in the local economy. Several factors can influence home prices, including mortgage rates, demographics, income growth, the supply of new housing, and speculative trends. Housing affordability is determined by the share of homes sold in an area that would have been affordable to a family earning the local median income. Housing affordability data comes from the National Association of Home Builders (NAHB).
Visit the MAP Dashboard to learn more!


