By George W. Hammond, Ph.D., EBRC Director and Research Professor
According to non-seasonally adjusted preliminary estimates from the Arizona Office of Economic Opportunity, Arizona jobs bounced back somewhat in May after a huge drop in April. The state added 45,200 jobs over the month, reflecting the relaxation of restrictions put in place to slow the spread of the coronavirus. The over-the-month growth rate was 1.7%, which translates into an annualized growth rate of 21.9%.
The Phoenix MSA added 30,400 jobs over the month in May, while Tucson added 7,500.
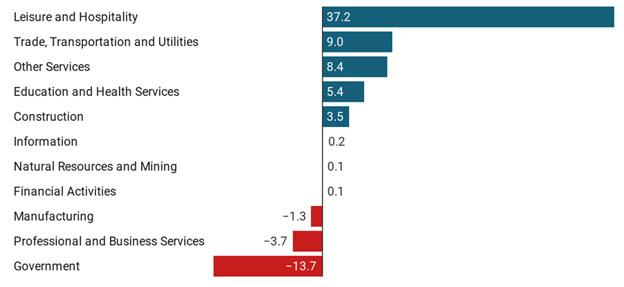
Exhibit 1 shows over-the-month job change (nonseasonally adjusted) for Arizona, broken out by major industry. Leisure and hospitality; trade, transportation, and utilities; other services and education and health services added the most jobs in May, reflecting the relaxation of restrictions. Manufacturing; professional and business services; and government (especially state and local government education) experienced job losses.
Within professional and business services, professional and technical services lost the most jobs in May. The decline there was partly seasonal since this sector on average lost 2,700 jobs over the month in May during the 2010 to 2019 period. Similarly, a portion of the drop in state and local education was likely influenced by normal seasonal variation. This sector lost an average of 8,900 jobs over the month each May since 2010.
Exhibit 1: Arizona Net Change in Jobs, Over the Month in May 2020, Thousands, Nonseasonally Adjusted

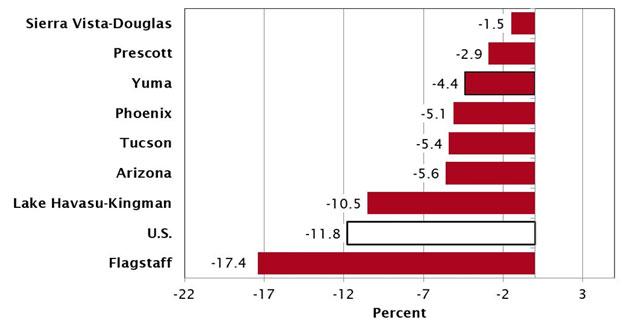
Even though the state added jobs on an over-the-month basis, we are still in a big hole. Exhibit 2 shows over-the-year job growth in May for the nation, Arizona, and Arizona’s metropolitan areas. Compared to last May, Arizona’s jobs have declined by 163,000 or 5.6%. This terrible performance, but less than one-half of the national percentage decline.
The Flagstaff MSA was the furthest below its year-ago level in May, followed by Lake Havasu-Kingman, Tucson, Phoenix, Yuma, Prescott, and Sierra Vista-Douglas.
Exhibit 2: Over-the-Year Job Growth in May, Percent

The state unemployment rate fell in May, reflecting the job gains. On a seasonally-adjusted basis, the Arizona unemployment rate was 8.9% in May, down from a revised 13.4% in April. The comparable national rate was 13.3% in May.
Exhibit 3: Arizona, U.S. and Western States, Unemployment Rates, Seasonally Adjusted
Weekly Roundup
Weekly data suggest continued gradual recovery of the state and national economies, but we still have a lot of ground to make up.
Arizona initial claims for regular unemployment insurance fell to 22,419 (revised) for the week ended June 13. Initial claims for Pandemic Unemployment Assistance (PUA) spiked to 118,335 last week, up from 96,416 the prior week.
According to the Arizona Department of Employment Security, the state has paid out $3.3 billion in regular and PUA benefits since the end of March. To give you a sense of scale, that is roughly 1.0% of state personal income in 2019.
Exhibit 4: Arizona Weekly Claims for Initial Unemployment Insurance and Initial Claims for Pandemic Assistance
The U.S. hotel occupancy rate rose again for the week ended June 13, to 41.7%. That was the eighth consecutive increase. However, occupancy rates still have a lot of ground to make up. Last year at this time the occupancy rate was 72%.
U.S. movie box office sales more than doubled during the week ended June 11, to $617.357. Still extremely low compared to sales this time last year, largely reflecting the fact that there were just nine movies released during the week.
TSA passenger throughput increased again, to 3.1 million, for the week ended June 13. Passenger screening has gradually increase since mid-April, but remained 82.2% below the year-ago level.
According to data from OpenTable, restaurant performance in Arizona and Phoenix continued to improve for the week ended June 13. Arizona seatings were down 44.1% over the year while seatings in Phoenix were down 51.2%. That was better than national performance, which was down 70.9%.
Mobility data from Google Maps suggests stabilization in travel to retail and recreation places in Arizona, Maricopa County, and Pima County. For the week ended June 6, travel was down 19.1% for the U.S., -19.7% for Arizona, 21.6% for Maricopa County, and 22.7% for Pima County, relative to January.
Finally, Arizona business applications (for EINs) increased to 510 for the week ended June 13, 4.1% above the year-ago level. The 52-week average continued to decelerate last week, to 0.5%.
Daily Indicators
Use your cursor as a tooltip and click on charts to view values. Click on the names of indicators listed at the bottom any chart to switch them on/off to view fewer at one time and make comparisons. Icon at the bottom of each table allows you to download data and share.
Weekly Indicators
Note: An advanced number for Arizona Initial Claims for Unemployment Insurance is released on Tuesdays covering the week ending the previous Saturday. We publish the advance number here on Tuesdays. The official release is issued on Thursdays at which point we replace the advance estimate with the official count.
Note: The official Initial Claims for Unemployment Insurance numbers for the U.S. are released every Thursday morning covering the week ending on the previous Saturday.
Note: Weekly movie ticket sales and number of releases are published on Thursdays covering the previous week beginning on Friday.


