Arizona’s Strong GDP Growth in 2024: How the State Stacks Up Nationally
EBRC Research Staff
Current data releases as of 28 March 2025
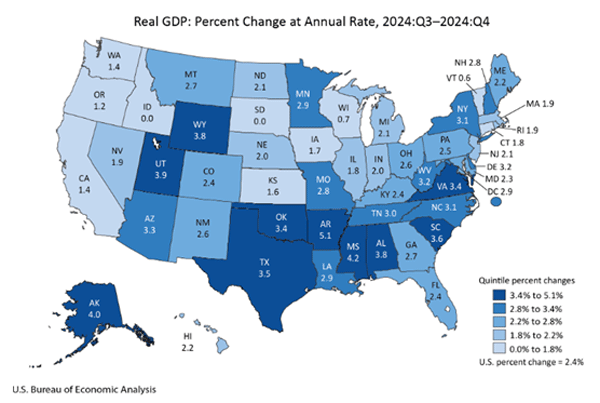
Arizona real GDP rose by 3.3% at a seasonally-adjusted annual rate over the quarter in the last quarter of 2024. That was well above the U.S. at 2.4% and ranked Arizona 11th in the nation (excluding the District of Columbia). State gains were powered by real estate and rental and leasing; health care and social assistance; professional, scientific, and technical services; finance and insurance; and state and local government. For the year, Arizona’s real GDP rose 5.6%, just above the U.S. at 5.3%. That ranked the state 22nd in the nation. – George Hammond

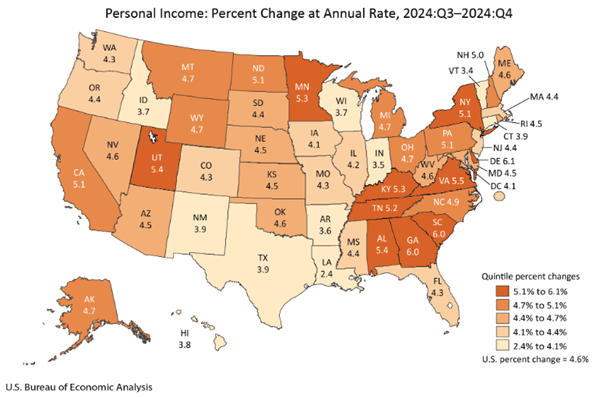
Arizona personal income rose 4.5% over the quarter to close out 2024 (seasonally-adjusted annual rate). That was slightly slower than the U.S. at 4.6%. It ranked Arizona 26th in the U.S. (excluding the District of Columbia). Personal income, before adjustment for inflation, rose the fastest in Delaware, followed by South Carolina, Georgia, Virginia, and Alabama. Personal income rose the slowest in Louisiana, Vermont, Indiana, Arkansas, and Idaho.

For 2024 as a whole, Arizona personal income rose 5.2% over the year, down from a 7.0% increase in 2023. That was also slightly below the national average of 5.4%. Keep in mind that data for 2024 will be revised later this year.
Arizona’s per capita personal income hit $64,456 in 2024. That was well below the national average of $72,425. In particular, Arizona’s per capita personal income was 89.0% of the national average in 2024, down from 89.6% in 2023 and ranking 36th in the nation (including the District of Columbia). – George Hammond
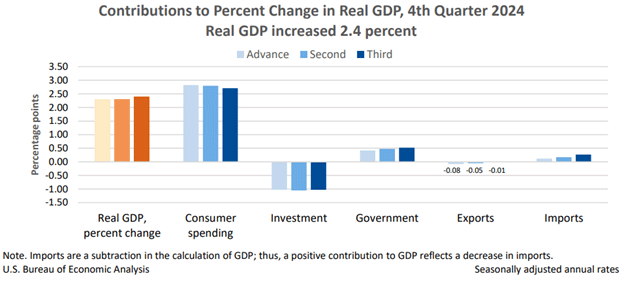
According to the third estimate, U.S. real GDP growth decelerated to 2.4% over the quarter in the fourth quarter of 2024. That was down from 3.1% in the third quarter. Growth in the fourth quarter was driven by consumer spending, with smaller positive contributions from government activity and net exports. Real investment spending (plant, equipment, housing, inventories, etc.) declined over the quarter. On the inflation front, the personal consumption expenditures (PCE) deflator rose 2.4% over the quarter. Excluding food and energy, the PCE deflator rose 2.6%. – George Hammond

According to the March 20th State Job Openings and Labor Turnover (JOLTS) report, the job openings rate decreased in two states, increased in three states, and was little changed in all other states. Arizona was one of the states that saw an increase in its job openings rate. The job openings rates for Arizona were 6.7% in January, 5.3% in December, and 5.7% for November. The number of job openings decreased in two, increased in six states, and were little changed in all other states.
The largest increase in the number of job openings was seen in Arizona (+53,000). The hire rates decreased in 11 states, increased in four states and was little changed in all other states. The hire rates for Arizona were 3.5% for January, 3.9% for December, and 3.5% for November. The number of hires decreased in 12 states, increased in five states, and were little changed in all others. The largest increase in hire levels were in Texas (+128,000) and New York (+39,000). The number of layoffs and discharges decreased in two states, increased in one state, and were little changed in all other states. Nationally, the layoffs and discharge rate was little changed. -Alex Jaeger
In February, over the month state unemployment rates were higher in 1 state and stable in the remaining 49 and the District of Columbia. The national rate was 4.1%. Arizona’s seasonally adjusted unemployment rate increased by 0.1 percentage points over the month to 4.0%. South Dakota had the lowest jobless rate in February at 1.9%, while Nevada had the highest unemployment rate at 5.8%. 30 states had unemployment rate increased from last year, the largest of which was in Michigan (+1.4 percentage points), while the only over-the-year rate decrease occurred in Montana (-0.2 percentage points). 19 states and the District of Columbia had jobless rates that were not notably different from those a year earlier. -Delaney O’Kray-Murphy
In January, over the year metropolitan unemployment rates were higher in 290 of the 387 metropolitan areas, lower in 64, and unchanged in the remaining 33. The January unemployment rate for the Tucson and Phoenix metropolitan areas came in at 3.9% and 3.5% respectively. Yuma had the highest unemployment rate in Arizona at 10.9%, while Phoenix had the lowest. Rapid City, SD, had the lowest unemployment rate at 2.0%, followed by Sioux Falls, SD-MN, at 2.1%, and Bozeman, MT, at 2.2%. El Centro, CA, had the highest rate at 17.9%. The largest increase over the year occurred in Asheville, NC (+3.1 percentage points), and Kahului-Wailuku, HI, had the largest decrease over the year (-2.2 percentage points). -Delaney O’Kray-Murphy
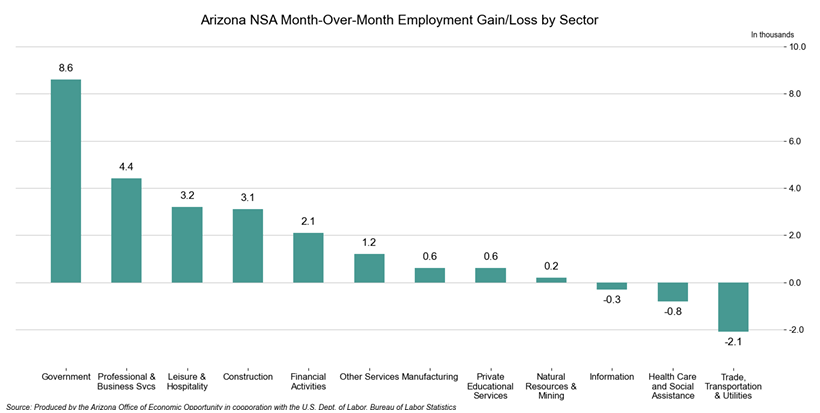
Total nonfarm employment in Arizona decreased by 13,500 jobs over the year in February, with the seasonally adjusted unemployment rate rising 0.1 percentage points to 4.0%. The U.S. seasonally adjusted unemployment rate similarly increased 0.1 percentage points to 4.1%. Arizona non-seasonally adjusted total nonfarm employment increased by 20,800 jobs over the month, worse than the pre-pandemic average of 25,100. Employment gains were reported in Government (8,600), Professional & Business Services (4,400), Leisure & Hospitality (3,200), Construction (3,100), Financial Activities (2,100), Other Services (1,200), Manufacturing (600), Private Educational Services (600), and Natural Resources & Mining (200). Employment losses were reported in Trade, Transportation & Utilities (-2,100), Health Care and Social Assistance (-800), and Information (-300). -Delaney O’Kray-Murphy

January house prices in Phoenix were 2.7% higher than the same period last year. Nationally, house prices gained 4.1% over the year in January while the 20-city composite for S&P CoreLogic Case-Shiller indices posted a year-over-year gain of 4.7%. New York again had the highest monthly increase, with a gain of 7.7%. Chicago and Boston followed with increases of 7.5% and 6.6%, respectively. There was one metro area with lower prices over the year, as Tampa had a decline of 1.5%. -Valorie Rice
There were 3,747 building permits authorized in Arizona during February, a decrease of 24.7%. Single-family permits were down 15.0% over the year statewide. The Phoenix-Mesa-Chandler metro area had 2,661 total permits in February, a drop of 32.8% from the year prior. Single-family permits likewise dropped 20.7% to 2,228. Total permits in Tucson were 421, and single-family permits were 389 for the month, decreasing 10.4% and 4.4% over the year, respectively. The Prescott Valley-Prescott metro area experienced a decline of 10.4% in total permits over the year in February but an increase in single-family units of 17.4%. Total February building permits were higher than in the same period last year in Apache, Cochise, Coconino, La Paz, Mohave, Navajo, Pinal, and Santa Cruz counties while they were down over the year in Gila, Graham, Maricopa, Pima, Yavapai, and Yuma counties and Greenlee County had no change. -Valorie Rice
The unemployment rate for veterans in the U.S. in 2024 was lower than the rate for nonveterans at 3.0% versus 3.9% according to the U.S. Bureau of Labor Statistics annual Employment Situation of Veterans report. For Arizona, the difference in the unemployment rates between veterans and those who have never served was more pronounced than the nation, with the rate for veterans at 1.8% compared to 3.6% for non-veterans. The state with the lowest unemployment rate for veterans in 2024 was New Hampshire, at 0.2%. Kansas posted the highest jobless rate for veterans at 7.2%, which was also higher than the nonveteran rate of 3.5% for that state. Like Arizona and the nation, most states reported lower unemployment rates for veterans than for non-veterans. In 2024, there were 5.3 million Gulf War-era II veterans in the U.S., representing those who served from September 2001 to the present. The unemployment rate for this group of veterans was 3.2% in 2024, similar to the 3.0% for all veterans. The jobless rate for all veterans as well as Gulf War-era II veterans was little changed from the year before. -Valorie Rice


