EBRC Research Staff
Current data releases as of 10 January 2025
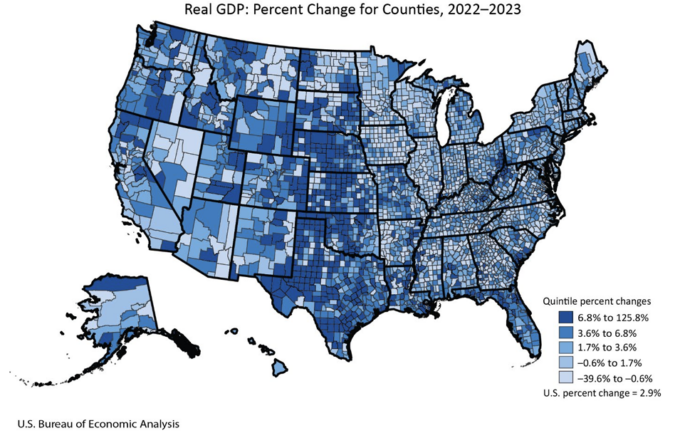
Arizona real GDP by county increased in nine counties between 2022 and 2023 with Pinal experiencing the biggest gain in GDP at 9.0%, followed by Pima at 4.6%, and Mohave at 4.3%. Six Arizona counties had decreases in GDP over the year, with the biggest drop in Greenlee at -8.1%. Arizona’s real GDP increased 3.0% in 2023. The percent change in real GDP for all counties in the nation ranged from 125.8% in Throckmorton County, TX, to -39.6% in Lincoln County, WA. Nationally, the change in real GDP was 2.9% in 2023. The release also included metropolitan areas. The percent change in real GDP for Arizona metropolitan areas between 2022 and 2023 were 4.6% in Tucson, 4.3% in Lake Havasu City-Kingman, 3.7% in Flagstaff, 3.0% in Prescott Valley-Prescott, 2.9% in Phoenix, and a decrease of 0.6% in Sierra Vista-Douglas. –Valorie Rice

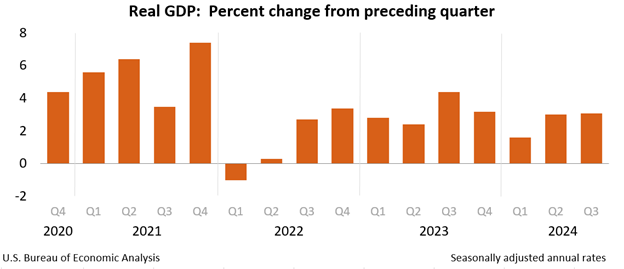
Real gross domestic product (GDP) increased at an annual rate of 3.1% in the third quarter of 2024, according to the “third” estimate, a 0.3 percentage point increase from the previous estimate. The increase in real GDP reflects upward revisions to exports and consumer spending that were partly offset by a downward revision to private inventory investment. Imports, a subtraction to GDP, were revised up. Compared to the second quarter, the acceleration in real GDP reflects increases in exports, consumer spending, and federal government spending, which were partially offset by a downturn in private inventory investments and a larger decrease in residential fixed investment. Current-dollar personal income, disposable personal income, and personal saving were all revised up from the previous estimate. The estimate for real GDI, an alternate measure to GDP, was revised down 0.1 percentage point to 2.1%, with the average of real GDP and real GDI rising 0.1 percentage point to 2.6%. –Delaney O’Kray-Murphy

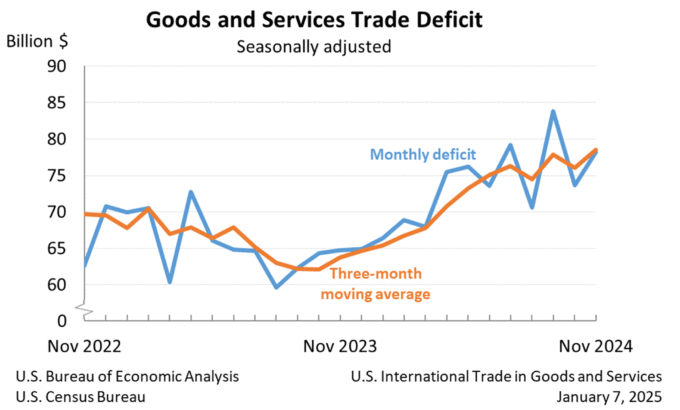
The November goods and services trade deficit came in at $78.2 billion, up $4.6 billion from a revised $73.6 billion in October. November exports rose $7.1 billion to $273.4 billion, and imports rose $11.6 billion to $351.6 billion. The increase in the goods and services deficit reflects an increase in the goods deficit of $5.4 billion to $103.4 billion and an increase in the services surplus of $0.9 billion to $25.2 billion. Year-to-date, the goods and services deficit increased $93.9 billion, or 13.0%, from the same period in 2023, with exports rising 4.0% and imports increasing 5.8%. The largest surpluses, in billions, were with Netherlands ($5.4), South and Central America ($3.6), and Australia ($2.0), while the largest deficits were with China ($25.4), European Union ($20.5), and Mexico ($15.4). –Delaney O’Kray-Murphy

The U.S. unemployment rate changed little in December at 4.1% while total nonfarm payroll jobs increased by 256,000, according to the Bureau of Labor Statistics January 10th employment situation summary. Job gains occurred in health care (46,000), government (33,000), and social assistance (23,000). Retail trade rose 43,000 after losing jobs in November. Employment in other major industries saw little change. In December, average hourly earnings for employees on private nonfarm payrolls increased by 10 cents (0.3%) to $35.69. The average workweek for private nonfarm employees was 34.3 hours. Monthly nonfarm payroll employment showed a monthly average gain of 186,000 in 2024.
Phoenix house prices barely moved in October, increasing 1.2% on a year-to-year basis. Nationally, house prices increased 3.6% over the year in October based on the S&P CoreLogic Case-Shiller Indices. The 20-city composite had an annual increase of 4.2%. These were all lower than the previous month’s reported gains. At 7.3%, New York was again the metro area with the largest increase in house prices over the year in October, marking this its sixth month leading the 20 cities tracked in the index. Tampa had the smallest gain at 0.4% over the year. Two other metro areas with less than one-percent gains were Denver at 0.4% and Dallas at 0.9%. Nearly all metro areas experienced a drop in prices between September and October, all of which were on the East Coast with Boston, New York, and Washington reporting gains over the month. –Valorie Rice
In November, Arizona over-the-year building permits had a 17.0% decline to 4641, not seasonally adjusted. The number of single-family permits in the state similarly declined 5.4% to 2883. The Phoenix MSA (Maricopa and Pinal counties) accounted for most of the permits in the state, with 3654, an 17.6% decrease from last November. The number of single-family permits fell 9.6% to 2013. The Tucson MSA saw declining permits as well, falling 30.9% to 300, with single family permits shrinking 31.3% to 241. Of the counties, Coconino, Mohave, Navajo, Santa Cruz, and Yavapai had increases, while Apache, Cochise, Gila, La Paz, Maricopa, Pima, Pinal, and Yuma saw decreases. No changes were observed in Graham and Greenlee. –Delaney O’Kray-Murphy
In November, over-the-year metropolitan unemployment rates were higher in 308 of the 389 metropolitan areas, lower in 60, and unchanged in the remaining 21. The November unemployment rates for the Tucson and Phoenix metropolitan areas came in at 3.8% and 3.5%, respectively. Yuma had the highest unemployment rate in the state with 13.6%, while Prescott had the lowest, with 3.3%. Sioux Falls, SD, had the lowest unemployment rate in the country, 1.5%, followed by Rapid City, SD, at 1.7%. El Centro, CA, had the highest rate at 19.0%. The largest over-the-year percentage increase occurred in Asheville, NC, (+3.4 percentage points), while the largest over-the-year decrease occurred in Kahului-Wailuku-Lahaina, HI (-3.0 percentage points). –Delaney O’Kray-Murphy
The November 2024 release of the Job Openings and Labor Turnover (JOLTS) report stated that the number of job openings in the U.S. changed little at 8.1 million. The job openings rate was 4.8% for the month. The industry with the largest increase was professional and business services (+273,000), while the largest decrease was in information (-89,000). The number of hires was 5.3 million, with a rate of 3.3% for November. The number of total separations in the nation was little changed at 5.1 million, with a rate of 3.2%. The number of quits decreased to 3.1 million with a rate of 1.9%. The number of layoffs and discharges changed little at 1.8 million and a rate of 1.1%. –Alex Jaeger
The 2023 American Community Survey (ACS) 5-year estimates were released in December. According to the latest data, most counties in the nation had more homeowners than renters. This was the case in Arizona, with 67.0% of the housing units in the state being owner-occupied vs. 33.0% renter occupied. The county with the highest percentage of owner-occupied housing units was Pinal at 80.5%, and the lowest was Greenlee at 55.8%. Nationally, 65.0% of housing units were owner-occupied. The two largest counties in the state mirrored the U.S., as Maricopa had 65.0% and Pima had 64.8%. The share of housing that was owned rose for the U.S. between the 2014-2018 ACS and the 2019-2023 ACS, moving up 8.4%. The change for Arizona was twice that, at 16.6%. All counties in Arizona, save La Paz, increased the share of housing units that are owned. The median household income for 2023 was $78,538 in the U.S. and $76,872 in Arizona. Among Arizona counties, only Maricopa posted a higher median income than the nation, at $85,518 while Pinal fell between the nation and the state at $77,588. The median household income in Pima County was $67,929. Apache County had the lowest median household income in 2023 at $40,338. The poverty rate decreased nationally to 12.4% in 2023 from 14.1% in 2018. Arizona’s poverty rate stood at 12.8%, a decrease from 16.1%. –Valorie Rice


