
EBRC Research Staff
Current data releases as of 23 August 2024
In July, over the month state unemployment rates were higher in 13 states, lower in one, and stable in the remaining 36 and the District of Columbia. Arizona’s seasonal unemployment rate increased 0.1 percentage point over the month to 3.4%. South Dakota had the lowest jobless rate in July at 2.0%, followed by Vermont at 2.1%, and North Dakota at 2.2%. The District of Columbia had the highest unemployment rate at 5.5%, followed closely by Nevada, at 5.4%. Twenty-eight states and the District of Columbia had over-the-year unemployment rate increases, while two states had over-the-year decreases: Arizona (-0.5 percentage point) and Mississippi (-0.4 percentage point).
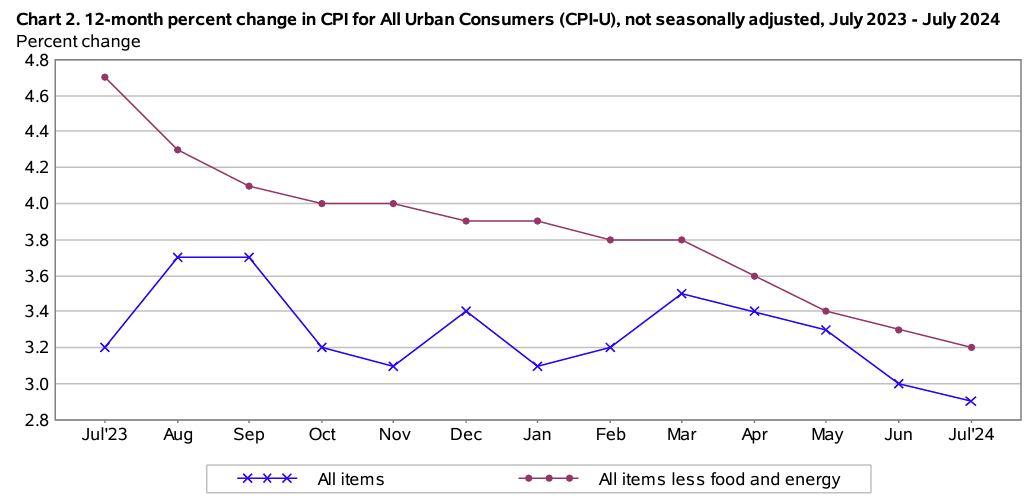
The monthly Consumer Price Index (CPI-U) rose 0.2% in July on a seasonally adjusted basis following a decline of 0.1% in June. Prices for shelter accounted for nearly all of the monthly increase in the all items index according to the U.S. Bureau of Labor Statistics August 14 release. Energy prices were unchanged in July after decreasing the previous two months. The food index rose 0.2% for the month with food away from home increasing 0.2% and food at home 0.1%. The index for all items less food and energy ticked up to 0.2% in July after increasing 0.1% in June. The annual inflation rate was 2.9% for July, which was the lowest since March 2021. The 12-month change in energy was 1.1% while food increased 2.2%. The 12-month change in all items less food and energy was at its lowest since early 2021, at 3.2%.
The July Producer Price Index rose 0.1% over the month on a seasonally adjusted basis. Final demand goods, which increased 0.6% for the month, were the main reason for the overall increase in producer prices as the index for final demand services decreased 0.2%. Energy prices and, more specifically, gasoline, were the main contributors to the increase in final demand goods for July. They were not the only factor, however, since the final demand for goods less food and energy increased by 0.2%, and the final demand for food rose 0.6% for the month. The unadjusted change in final demand producer prices over the year was 2.2% in July, down from 2.7% in June.
According to the August 16th State Job Openings and Labor Turnover (JOLTS) report, the job openings rates decreased in two states, increased in two states, and were little changed in all other states. The job openings rates for Arizona were 5.7% in June, 4.8% in May, and 5.4% in April. The number of job openings decreased in two states, increased in two states, Arizona being one of those, and was little changed in all other states. The largest decreases in the number of job openings were seen in New York (-39,000) and Arizona (-33,000). Hire rates decreased in six states, increased in three states, and changed little in all other states. Montana had the largest increase of +1.8 points. Hire rates for Arizona were 4.0% for June and 3.8% for both May and April. The number of hires decreased in eight states, increased in three states, and little changed in all others. California (-71,000) had the largest decrease in hire levels. The number of layoffs and discharges decreased in five states and was little changed in all other states. The national layoffs and discharges rate decreased by -0.2 percentage points. Nationally, the layoffs and total separations rates were little changed.
The National Association of Home Builders (NAHB) dropped its Housing Opportunity Index affordability measure earlier this year and replaced it with the Cost of Housing Index (CHI). The NAHB/Wells Fargo CHI reports on how much of a typical family’s income is needed to make a mortgage payment on an existing home, similar to a housing cost burden measure. In the second quarter of 2024, a family earning the national median income would use 39% of their income to cover the mortgage payment on an existing home. This is based on the national median family income of $97,800 and a $422,100 price for an existing home, factoring in an assumption of a 10% down payment plus taxes, insurance, and PMI. Unfortunately, with the new index, Tucson and Phoenix are now the only Arizona metropolitan areas reported. The share for Tucson in the second quarter of 2024 was below the U.S. at 38% while Phoenix was above the U.S. at 40%. Some of the most cost-burdened markets in the nation were in California, with San Jose-Sunnyvale-Santa Clara, CA, reporting that 94% of a typical family’s income was needed to make a mortgage. Of the 176 markets tracked in the CHI in the second quarter of 2024, 14 of them indicate a severe cost-burden in that more that 50% of a typical family’s income would go to housing costs, 89 would be considered cost-burdened (more than 30% but less than 50% of expenses going to housing), and 73 markets had no cost burden for a typical family.
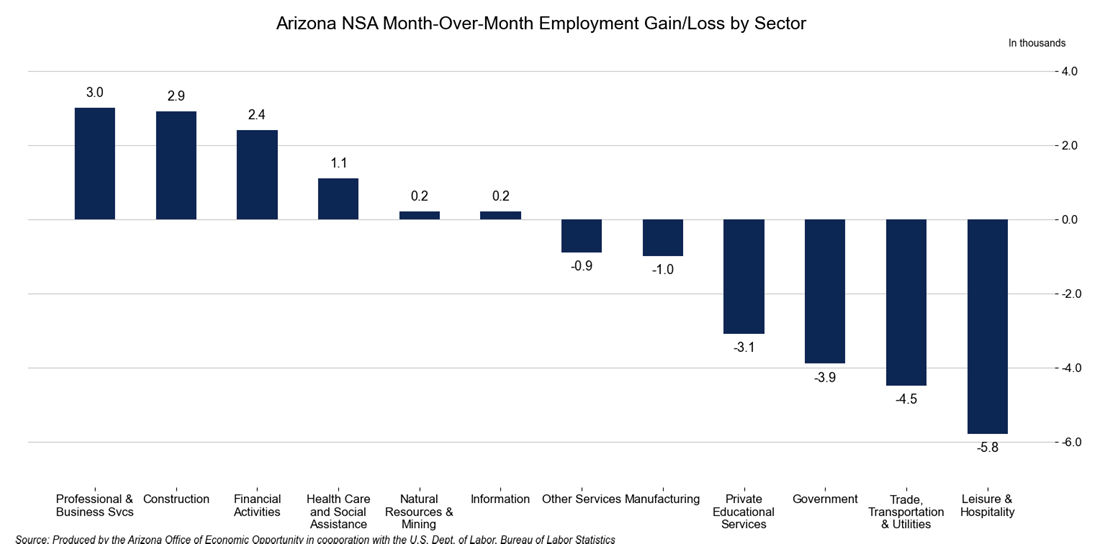
Total nonfarm employment in Arizona increased by 74,300 jobs over the year in July, with the seasonally adjusted unemployment rate increasing to 3.4% from 3.3% in June. The U.S. seasonally adjusted unemployment rate increased from 4.1% in June to 4.3% in July. Arizona’s non-seasonally adjusted total nonfarm employment decreased by 9,400 over the month, less severe than the pre-pandemic average of -19,900. Employment gains were reported in professional & business services (3,000), construction (2,900), financial activities (2,400), health care and social assistance (1,100), natural resources & mining (200), and information (200). Losses were reported in leisure & hospitality (-5,800); trade, transportation, & utilities (-4,500); government (-3,900); private educational services (-3,100); manufacturing (-1,000); and other services (-9,00).
In July, Arizona’s over-the-year total building permits saw a slight 6.8% decrease to 5,003, not seasonally adjusted. The number of single-family permits increased 13.6% over the year to 3,531. The Phoenix metropolitan area accounted for most of the permits in the state with 3,436, a 17.0% over-the-year decrease. On the other hand, the number of permits in Tucson saw a significant increase, rising 76.1% to 655 over the year. Of the counties, Cochise, Gila, Graham, La Paz, Navajo, Pima, Pinal, Santa Cruz, Yavapai, and Yuma all saw increases, while Coconino, Maricopa, and Mohave saw decreases. No changes occurred in Apache and Greenlee.