
George W. Hammond, EBRC director and Eller research professor
Job openings per unemployment resident have been trending up
Arizona’s seasonally-adjusted unemployment rate ticked up from an all-time low of 3.3% in June to 3.4% in July. That was down from 3.9% in July 2023 and below the 4.3% U.S. rate.
Over the past year, Arizona’s labor market has normalized in some respects but remains tight. The latest data (June 2024) from the Job Openings and Labor Turnover Survey show that the state job quit and hire rates have fallen from recent peaks and are now well below pre-pandemic levels. Arizona’s hires rate in June was 4.0%, which was down from 4.3% on average in 2019. The quit rate was 2.3% in June, down from 2.8% on average in 2019. Exhibit 1 shows smoothed hire and quit rates for the state.
Exhibit 1: Arizona Quit and Hire Rates, Seasonally Adjusted, Twelve-Month Moving Average, Percent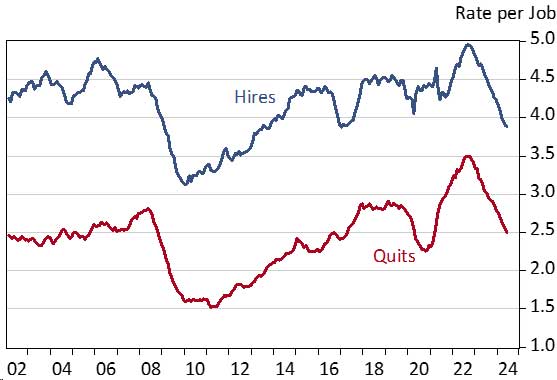
Other aspects of Arizona’s labor market performance (in addition to the unemployment rate) suggest continued tightness. One example is the ratio of job openings to the number of unemployed residents (Exhibit 2). After briefly dropping to near pre-pandemic levels (of about one job per unemployed resident), Arizona’s ratio bounced back to 1.6 openings per job in June. That was well above the national ratio of 1.2. The rise in Arizona’s ratio was driven both by rising job openings and falling unemployment.
Exhibit 2: Arizona and U.S. Job Openings per Unemployed Resident, Seasonally Adjusted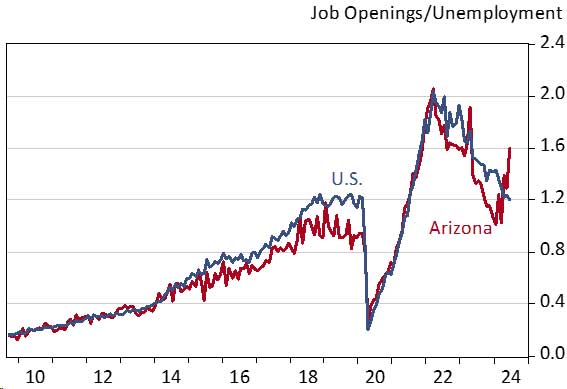
Arizona seasonally-adjusted jobs bounced up by 3,000 in July 2024, after a revised decline of 2,500 in June. The preliminary estimate suggested that jobs dropped by 1,900 in June.
Over-the-month job gains in July were driven by professional and business services (up 2,100); construction (up 1,600); financial activities (up 1,100); and government (up 800). Information (up 400); private education and health services (up 400); other services (up 200); and natural resources and mining (up 100) generated small gains.
Leisure and hospitality (down 1,500); manufacturing (down 1,300); and trade, transportation, and utilities (down 900) dropped jobs over the month.
Arizona nonfarm jobs were up 74,300 over the year in July, which translated into 2.4% growth. That outpaced the U.S. at 1.6%. Year-to-date through July state jobs were up 2.2% over the same period in 2023.
Over-the-year job gains in July were driven by private education and health services; professional and business services; trade, transportation, and utilities; construction; government; and financial activities (Exhibit 3). Other services and natural resources and mining jobs were up modestly. In contrast, jobs were down in information; leisure and hospitality; and manufacturing.
Exhibit 3: Arizona Net Job Change (Thous.) and 2023 Annual Wages per Worker
Phoenix MSA (Maricopa and Pinal counties) jobs rose 61,600 over the year in July, for 2.6% growth. That accounted for 82.9% of state gains. On average through July, Phoenix jobs were up 2.3% over the year. Job gains by sector were similar to the state.
In July, Tucson jobs were rising at a more modest pace, up 4,600 for 1.2% growth. That accounted for 6.2% of state gains. Through the first seven months of 2024, Tucson jobs were up 1.1% over the year.
From July 2023 to July 2024, Tucson job gains were mainly driven by private education and health services; financial activities; construction; manufacturing; and other services. Jobs were down in professional and business services and leisure and hospitality.
Prescott MSA jobs rose 900 over the year in July for 1.3% growth. Year-to-date, jobs were up 1.5% over the year.
In July, Prescott jobs were driven by gains in private education and health services and government. Jobs were down in leisure and hospitality and professional and business services.