Valorie H. Rice, Senior Business Information Specialist
Data from the 2022 Census of Agriculture show Arizona’s similarities and differences to the nation
The story of agriculture in Arizona can be considered one of contrasts. More than a third of the state’s land is used for farming and ranching even though the number of acres devoted to agriculture has declined over the last decade. Along with fewer acres, there are fewer farms with the average size of farms growing. Arizona farmers tend to be older and more experienced than the rest of the nation; however, there are pockets of the state with an increasing share of younger farmers. La Paz County seemed to challenge trends with more farm operations, more farm producers, and more beginning producers between 2017 and 2022 while the rest of the state experienced declines. The state has the largest share of female farm producers as well as Native American producers in the nation, yet in most counties farm producers are predominantly white and male. There are several agricultural products the state surpasses much of the country in, many of which are found in three counties with billions of dollars of sales even though most counties in Arizona have far less market value for their goods. Every five years, the Census of Agriculture provides an image of how America’s farms and farmers have changed and in what ways they have remained the same. Here is a summary of Arizona’s agricultural landscape based on the most recent data.
What agricultural products does Arizona grow?
Arizona is among the top states for sales of vegetables, melons, potatoes, and sweet potatoes, coming in fifth among all states behind California, Florida, Washington, and Idaho. Arizona’s strong showing is due mainly to fresh produce in Yuma County, particularly lettuce. Notable agricultural product sales within Arizona counties include Yuma, which had the third largest sales of all counties in the US for the vegetables, melons, potatoes, and sweet potatoes category; Maricopa, which had the fourth largest sales of all counties in the US for the other crops and hay category; and Pinal, which ranked eighth out of all counties in the nation for cotton and cottonseed sales.
The top categories of farm products in Arizona by percent of total sales in the state were vegetables, melons, potatoes, and sweet potatoes followed by milk from cows, cattle and calves, and other crops and hay. Exhibit 1 includes a list of the top agricultural products produced by the state, the market value of sales (when available), how many farms are involved, and which counties are the top producers of each. [A (D) means data are withheld to avoid disclosing data for individual farms.] The top seven product categories comprise over 90 percent of the state’s agricultural sales. The top five crops by acreage in 2022 were forage (hay/haylage), vegetables, cotton, wheat, and lettuce, closely matching the top agricultural products in the state. Not included in the top categories for sales or acreage but are still notable products for Arizona are horses, ponies, mules, burros, and donkeys; other animals and other animal products; sheep, goats, wool, mohair, and milk; and aquaculture.
Exhibit 1: Arizona Agricultural Products Ranked by Market Value, 2022
Of the $5.2 billion in agricultural products produced in Arizona during 2022, 58.4% of that reflected crops and 41.6% for livestock commodities. Nationally, the division between crop and livestock commodities was closer to even at 51.7% crops and 48.3% livestock. Most Arizona counties were heavily weighted to one side or the other (Exhibit 2). Maricopa County tallied the largest total market value of agricultural goods at $1.6 billion, followed closely by Yuma County at $1.5 billion and Pinal at $1.2 billion. Those three counties combined accounted for more than 80% of the total market value of agricultural products for the state. The value of agricultural goods increased by 35.1% in Arizona between 2017 and 2022. Over the same period, the big three counties had similar gains at 28.9% for Maricopa, 31.8% for Yuma, and 35.7% for Pinal; however, the value of agricultural products more than doubled in Cochise County during that period, increasing 135.3%. Not all counties reported increases, as Apache, Coconino, Graham, Greenlee, Navajo, Santa Cruz, and Yavapai had lower market sales in 2022 compared to 2017.
Exhibit 2: Value of Agricultural Production in Arizona Counties, 2022
The number and size of farms
The amount of farmland and total number of farms has steadily decreased in Arizona and the nation over the last decade; however, the average size of farms has grown. The number of farms in Arizona decreased over the last ten years, shrinking from 20,005 in 2012 to 19,086 in 2017 and down to 16,710 in 2022. Arizona is not alone in this occurrence. Between 2012 and 2022, farms declined by 9.9% nationally. The Census of Agriculture defines a farm as any place from which $1,000 or more of agricultural products were produced and sold, or typically would have been sold, during a census year.
The number of farms decreased between 2017 and 2022 in every Arizona county except one. There were more farms in La Paz County in 2022 than five years previously, though it was still less than the number of farms reported in 2012. As noted in Exhibit 3, all Arizona counties had fewer farms than they did ten years ago.
Exhibit 3: Number of Farms in the U.S., Arizona, and Arizona Counties, 2012-2022
Texas had the largest number of farms in 2022 at 230,662 while Rhode Island had the fewest at 1,054. Arizona ranked 37th for the total number of farm operations by state. The top five states for the number of farms were Texas, Missouri, Iowa, Ohio, and Illinois.
As the number of farms shrank, the average size of farms expanded. In Arizona, the average size of farms was 1,528 acres in 2022, 159 acres more than in 2017, and even higher still than the 1,312 reported in 2012. Nationally, the average farm size was 463 acres in 2022, down from 441 in 2017 and 434 in 2012. This may seem small in contrast to the average size listed for Arizona, which was among only seven states with an average farm size larger than 1,000 acres in 2022. Those seven were Wyoming, Montana, Nevada, New Mexico, North Dakota, Arizona, and South Dakota. Within Arizona, the average size of farms (measured by total acres divided by number of farms) ranged from 245 acres in Greenlee to 6,953 acres in Gila based on the most recent data.
The total acreage of farm and ranch land in the state for 2022 was 25,525,087, down 2.3% from five years ago. Nationally, land in farms was down 2.2% during the same period. Not all Arizona counties experienced a loss of acreage. Cochise, Gila, Maricopa, Mohave, Navajo, and Pinal reported more acres devoted to farming in 2022 than in 2017. By size, Apache and Coconino counties had the highest farm acreage in 2022 while Greenlee had the least.
Despite the large average size of farms in the state, the actual size of operations varied. In 2022, over half of the farms in Arizona (54.8%) were smaller than ten acres and the vast majority (76.1%) were considered small farms, or those having fewer than 50 acres. Greenlee, Apache, Navajo, and Coconino counties contain the highest portion of small farms, with more than 80% of farms having fewer than 50 acres. Exhibit 4 shows that La Paz, Cochise, and Santa Cruz counties had the lowest percentage of small farms in 2022. La Paz, Mohave, and Cochise counties had the largest share of farms with more than 1,000 acres. Coconino County had many farms on either end of the spectrum – those with fewer than 50 acres and those with more than 1,000 acres.
Exhibit 4: Percent of Farms by Size in 2022, Arizona Counties
Arizona ranks among the states with the highest percentage of small farms. In Arizona, 76.1% of farms are fewer than 50 acres in size. Only Hawaii and Rhode Island had greater percentages of small farms. As one would expect, Great Plains states are the least likely to have smaller-sized farms. Less than a quarter of all farms in Nebraska, Kansas, South Dakota, and North Dakota have fewer than 50 acres. Nationally, 42.2% of farms are considered small.
Farm operations and income
Family farms make up the vast majority of farming operations in Arizona. Indeed, more than 94% of farms in the U.S. fall into this category, which is described as being more than 50% owned by one producer’s household or extended family. In Arizona, 94.0% are family farms, and family ownership by county ranges from 74.9% in Graham to 97.6% in Apache. On the other hand, a small percentage of farms in Arizona were owned by corporations. The legal status for tax purposes indicated that 82.8% of farms were owned by families or individuals, 5.8% by partnerships and only 5.3% of farms in the state are corporations, either family or other. Nationally, 6.7% of farms are corporate operations. Yuma County had the highest percentage of corporate farms in the state at 21.7%. Apache and Navajo counties, nearly equal in their share of family farms, had less than one percent corporate ownership. Partnerships comprise a small portion of farm ownership. An even smaller portion is listed as “other” which can include American Indian reservations, grazing associations, prison farms, or an estate or trust.
Net cash farm income increased tremendously in Arizona for 2022 after a poor showing in 2017. The per farm average for farm operations was up almost 300% for the state, at $72,599 compared to $18,231 in 2017. Nationally, the average net cash income for 2022 was $79,790. The components of farm income are the value of agricultural products sold, government payments, and farm-related income. All that minus production expenses provides net income. Depreciation is not used in the calculation of net cash farm income.
The market value of agricultural products in Arizona, described in the first section of this article, are typically divided between crops and livestock. Government payments originate from a variety of conservation programs, disaster payments, and other federal farm programs but do not include federal crop insurance payments. Income from farm-related sources includes such things as Agri-tourism and recreational services like farm or wine tours, income from renting out farmland or pasturing livestock, animal boarding, and crop and livestock insurance payments. When expenses are larger than revenues from products sold, farm-related income or government payments, that can lead to net losses. Farm production expenses are extensive and can include livestock or poultry purchases or leases, feed, veterinary services, crop seed, hired farm labor, equipment purchase or lease, repair and maintenance costs, fertilizer or other soil conditioners, gasoline or other fuels, utilities, rent for land or buildings, and interest on debts.
For Arizona, total farm expenses were higher in 2022, but the value of products sold rose even more. This was not the case throughout the state, with per farm average net income ranging from -$19,020 in Yavapai County to $1,331,246 in Yuma County. While net cash income per farm increased for some places between 2017 and 2022, it decreased in others. Farms can be divided into two categories: those with net gains (including those that broke even) and farms with net losses. Nationally, 42.9% of farms had net gains in 2022 while the figure was lower in Arizona, at 18.4%. Only two counties had more than half of farms reporting net gains for the year, those being La Paz (63.6%) and Yuma (52.1%) as noted in Exhibit 5.
Exhibit 5 – Farm Income and Net Gains, 2022
Characteristics of farmers
The Census of Agriculture uses the general term producers for farmers – the terms are used interchangeably in this article. The number of producers in Arizona shrank from 32,796 in 2012 to 29,100 in 2022. The number of producers decreased in every county except La Paz. Beginning with the 2017 Census of Agriculture, information on up to four producers per farm operation is collected. Most farms in Arizona had just one or two operators in 2022. Within the state’s 16,710 farms, 7,726 had one producer, 6,590 had two, 2,083 had three or four, and 311 had five or more.
The demographics of Arizona farm producers differ from the national average in several ways. Arizona was the top state for female producers making up 47.9% of total producers state-wide compared to 36.3% nationally. Most counties in the state, save La Paz, reported females as more than a third of all farm producers. Female producers were the majority in the three Arizona counties that are part of the Navajo Nation – Coconino with 52.9%, Apache with 52.6%, and Navajo with 51.0%. Nationally, American Indian or Alaska Native producers were more likely to be female and this holds for Arizona as well. These three counties also represent the largest percentage of American Indian or Alaska Native farm producers at 88% or more. La Paz and Graham also had sizable shares of American Indian or Alaska Native producers at 32.1% and 26.2%, respectively (both of these counties contain American Indian reservation lands as well). It is important to note that these data reflect the number of producers that reported their race as American Indian or Alaska Native only. Regardless of whether the data contained single race only or included multiple races, Arizona had the largest share of American Indian or Alaska Native farm producers of any state in the nation.
Aside from the counties with large shares of American Indian or Alaska Native producers, Arizona’s farm producers were predominantly white, with 9 out of the 15 counties in the state reporting more than 80% of producers being white. La Paz County had the largest share of Hispanic or Latino farm producers, and at 39.9%, far more than any other part of the state. The percentage of Hispanic or Latino farm producers in Arizona was 4.9%, similar to the 3.3% reported for the U.S. Hispanic or Latino producers can be of any race. Exhibit 6 shows how Arizona counties compare demographically and how they track with the nation.
Exhibit 6 - Demographics of Arizona Farm Producers
The average age of farmer producers in Arizona was 60.1 years in 2022, two years older than the average for the U.S. at 58.1 years. This was older than in 2017 when the average age was 59.4 years for Arizona and 57.5 years for the nation. Arizona was also the state with the highest proportion of experienced farmers, with over three-quarters of farm producers declaring they had been farming for more than 10 years. In fact, the average number of years working on any farm operation was 26.9 years in Arizona compared to 23.4 years nationally. While Arizona farmers are older and more experienced than most of the country, some counties have a larger percentage of young farmers. La Paz had the most sizable share of young farmers in the state, those under 35 years of age. It also represented the largest percentage of new and beginning farmers, with more than 40% of farmers in the county having 10 or fewer years of experience (Exhibit 7). Nationally, a third of producers have farmed for 10 or fewer years.
Exhibit 7: Age and Experience of Arizona Farm Producers
Arizona farmers are a dedicated bunch. The state had the largest share of farm producers indicating farming as their primary occupation, meaning they spent 50 percent or more of their work time on farming. Following that, many farm producers do have jobs outside of the farm for financial or personal reasons. One question asked reflects the number of days worked off the farm. Arizona ranked third out of all states for the percentage of producers who worked exclusively on the farm, with no days reported as working off the farm. Only Delaware and North Dakota ranked higher. Equally, the state reported the smallest share of farm producers that worked more than 200 days off the farm in a year, at 30.4% compared to 39.7% nationally. Within Arizona, there was only one county that did not follow suit. Graham County had 60.2% of farm producers who worked more than 200 days off the farm. This was also reflected in the percentage of those indicating farming as a primary occupation, with Graham County reporting 25.9%; other counties in the state ranged from 41.2% (Gila) to 68.8% (Apache).
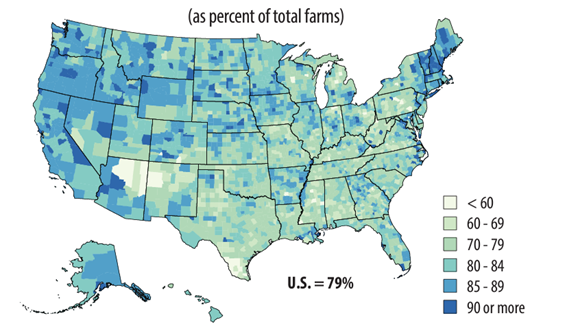
Arizona ranked last among all states for the percentage of operations with internet access in 2022 as it had in 2017. Nationally, 78.7% of farms had internet access in 2022, but for Arizona it was 66.5%. The most digitally connected state was New Hampshire at 89.6%. Farms in Arizona that do have internet service were more likely to rely on access via mobile service than with broadband. Access via broadband made up 31.3% of Arizona farms with internet access compared with 55.4% in the U.S. Within Arizona, the share of farm operations with internet access ranged from 48.9% in Apache to 91.6% in La Paz, a whopping 42.7 percentage point difference. Most counties in the state had greater than 80% of farms with internet access – though Apache, Coconino, and Navajo were among the counties with the lowest portion of access in the nation (see Exhibit 8). Navajo and La Paz counties experienced the largest expansion of internet access between 2017 and 2022.
Exhibit 8: Internet Access by County, 2022
Organic and direct to consumer sales along with renewable energy
A small number of farms in Arizona have organic production, but that has grown over the last five years. The number of farms with organic product sales went from 74 in 2017 to 89 in 2022. Even more so, the sales of organic production have grown remarkably. Organic product sales in Arizona made up a little over three percent of total agricultural sales for the state in 2022 at $165,682,000. This was an increase of 69.1% from the $97,956,000 posted for organic sales in 2017. Despite the impressive growth, Arizona remained the twelfth-largest state for organic sales in 2022, the same ranking as in 2017. Vermont was far and away the leader in total farm sales that are organic at 13.3% (compared to 3.2% in Arizona and 1.8% in the U.S.). While ten counties in Arizona reported organic sales, Maricopa and Yuma counties had the most organic farms and sales in the state.
There were 751 farms statewide that sold food directly to consumers, making up 4.5% of all farms. Maricopa (174) and Cochise (118) had the most farms selling directly to consumers. Both counties had more direct to consumer farms in 2022 than in 2017, unlike the state which saw a decrease. The total amount of sales for direct-to-consumers is quite small, making up less than one percent of the overall amount of farm sales in the state. Additionally, the value of food sold directly to consumers dropped in 2022 with some counties experiencing a substantial decrease, including Maricopa, Pima, and Yuma. Most other counties in the state, however, tallied an increase in the dollar value of food sold directly to consumers over the last five years.
Solar panels were the likeliest use of renewable energy on farms in Arizona for 2022. There were 1,445 farm operations in the state that indicated the use of renewable energy with 1,414 of those using solar panels. There were 91 farms using wind turbines and another 18 leased wind rights to others. Smaller numbers of farms used methane digesters or small hydro systems.