EBRC Research Staff
Current data releases as of 25 July 2024
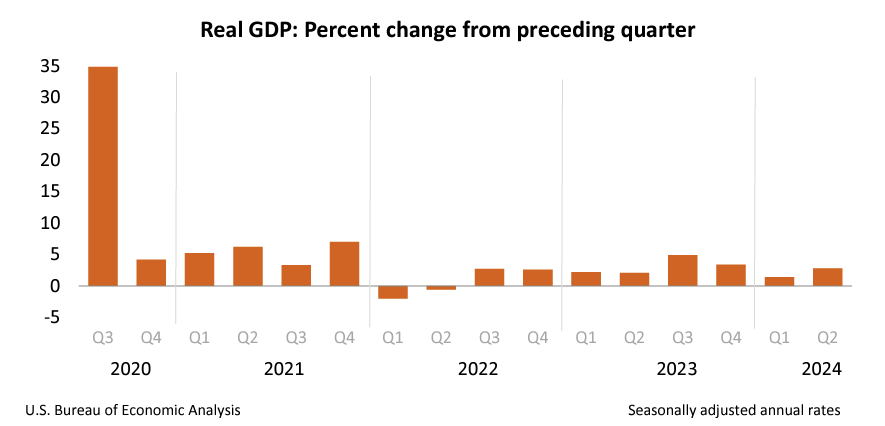
Real gross domestic product (GDP) increased at an annual rate of 2.8% in the second quarter of 2024, according to the advanced estimate released by the Bureau of Economic Analysis. In the first quarter, real GDP increased 1.4%. The increase in real GDP reflects increases in consumer spending, private inventory investment, and nonresidential fixed investment. Imports, a subtraction of GDP, increased. Current-dollar GDP increased at an annual rate of 5.2% in the second quarter while the first quarter increase was 4.5%. The price index for gross domestic purchases increased 2.3% in the second quarter, compared with an increase of 3.1% in the first, and the personal consumption expenditures (PCE) price index rose 2.6%, compared with an increase of 3.4%. Current-dollar personal income, disposable personal income, and real disposable income all saw gains, while personal savings and the personal saving rate both decreased from the first quarter. — Delaney O’Kray-Murphy
Consumer prices eased again in June as the monthly Consumer Price Index for All Urban Consumers (CPIU) decreased 0.1% on a seasonally adjusted basis after having no change in May. The energy index declined by 2.0% over the month, led by a drop in gasoline prices. The index for food was up 0.2% for the month with both food at home and food away from home reflecting increases. The index for all items less food and energy increased 0.1% in June. The annual inflation rate was 3.0% for June, lower than May at 3.3%. The 12-month change in all items less food and energy was the lowest since April 2021, at 3.3%, while food increased by 2.2%, and the energy index rose by 1.0%. –Valorie Rice
Use your cursor as a tooltip and click titles on/off in the legend at the bottom of the chart to make comparisons.
The Producer Price Index rose 0.2% in June on a seasonally adjusted basis after remaining flat in May. Final demand services increased 0.6%, most of which can be attributed to final demand trade services. Final demand goods, on the other hand, decreased by 0.5% for the month, much of that was due to a 2.6% decline in energy prices and more specifically gasoline. The 12-month change in producer prices rose to 2.6%, which is the highest it has been since March 2023. –Valorie Rice
Total nonfarm employment in Arizona increased by 66,200 jobs over the year in June, with the seasonally adjusted unemployment rate decreasing to 3.3%, a record low for Arizona. The U.S. seasonally adjusted unemployment rate increased to 4.1% from 4.0% last month. Arizona’s non-seasonally adjusted total nonfarm employment decreased by 46,300 over the month, beating the pre-pandemic average of -51,600 jobs. Over the month employment gains were reported in financial activities (2,400); construction (400); manufacturing (200); natural resources & mining (100); and information (100). Losses were reported in government (-34,000); professional & business services (-5,000); private educational services (-4,600); leisure & hospitality (-2,900); trade, transportation & utilities (-2,000); and health care and social assistance (-1,000). No net change was reported in other services. –Delaney O’Kray-Murphy

In June, over the month state unemployment rates were higher in eight states, lower in one, and stable in the remaining 41 and the District of Columbia. Arizona’s seasonally adjusted unemployment rate decreased 0.1 percentage point over the month to 3.3%, a new series low. South Dakota had the lowest jobless rate in June at 2.0%, followed by North Dakota and Vermont, at 2.1% each. The District of Columbia had the highest unemployment rate at 5.4%, followed by California and Nevada with 5.2% each. Thirty-one states and the District of Columbia had over-the-year unemployment rate increases, while two states had over-the-year decreases: Arizona and Mississippi. –Delaney O’Kray-Murphy
In June, Arizona’s over-the-year total building permits saw a 39.3% increase to 5351, not seasonally adjusted. The number of single-family permits rose 10.9% over the year to 3367. The Phoenix metropolitan area accounted for most of the permits in the state, with 4125, a 45.1% over-the-year increase. The number of permits in Tucson similarly increased, rising 27.5% to 459 over the year. Of the counties, Coconino, Gila, Greenlee, La Paz, Maricopa, Mohave, Navajo, Pima, Pinal, and Yuma all saw increases, while Apache, Cochise, Graham, Santa Cruz, and Yavapai saw decreases. –Delaney O’Kray-Murphy
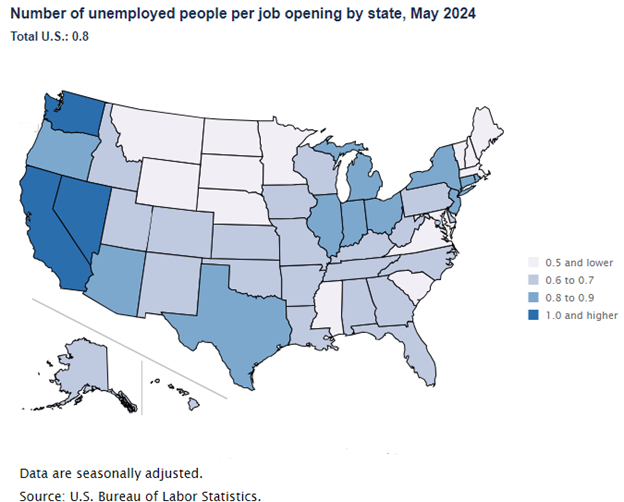
According to the July 24th State Job Openings and Labor Turnover (JOLTS) report, the job openings rate decreased in one state, increased in six states, and was little changed in all other states. The job openings rate for Arizona was 4.8% for May, 5.4% for April, and 4.3% for March. The number of job openings increased in six states and decreased in three states: Texas (-76,000), Tennessee (-22,000), and Arizona (-21,000). All other states had minimal changes. The largest increase in the number of job openings was in California (+90,000). Hire rates decreased in one state, increased in three states, and changed little in all other states. North Dakota saw the largest increase with +0.8%. The hire rate for Arizona was 3.9% for May, 3.8% for April, and 3.4% for March. The number of hires decreased in one state, Louisiana, increased in three states (New York, Michigan, and North Dakota), and changed little in all others. The number of layoffs and discharges decreased in two states, increased in four states, and were little changed in all other states. The largest increase was seen in Florida (+51,000) while Arizona experienced the largest decrease at -12,000. Nationally, the layoffs and discharges rate and total separations rate were little changed. The number of unemployed people per job opening was o.8 in Arizona, the same ratio as in the U.S. North Dakota had the smallest number of unemployed people per job opening at 0.3, while California had the largest, at 1.5. –Alex Jaeger