
George W. Hammond, EBRC director and Eller research professor
The preliminary state unemployment rate fell to another new low of 3.3%
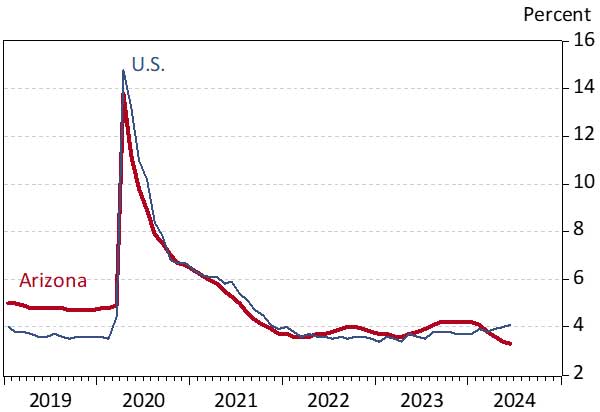
Arizona’s preliminary seasonally-adjusted unemployment rate dropped again in June, falling from 3.4% in May to 3.3%. Arizona’s rate was also below the U.S. at 4.1%. The main driver of Arizona’s falling unemployment rate has been consistent declines in the number of unemployed residents. That count has dropped for eight consecutive months, generating a reduction of 34,000 since October 2023.
As Exhibit 1 shows, the Arizona and U.S. rates have recently trended in different directions. Even so, through May, the differences have not been statistically significant. We’ll find out in about a week if the June difference was significant.
Exhibit 1: Arizona and U.S. Unemployment Rates, Seasonally Adjusted, Percent
Arizona seasonally-adjusted jobs declined by 1,900 over the month in June, after a revised 2,100 increase in May. The preliminary estimate for May was an increase of 4,400.
In June, over-the-month job losses were driven by trade, transportation, and utilities (down 2,200); professional and business services (down 2,100); and leisure and hospitality (down 1,200). Manufacturing jobs were down 300 and private education and health services were down 200.
In contrast, jobs were up 2,000 in government, followed by financial activities (up 1,800). Construction jobs were up 200 and other services jobs were up 100. Jobs were unchanged in natural resources and mining, as well as information.
Over the year, Arizona added 66,200 jobs (non-seasonally adjusted) which translated into growth of 2.1%. That outpaced the U.S. at 1.6%.
As Exhibit 2 shows, private education and health services generated the most jobs from June 2023 to June 2024, followed by trade, transportation, and utilities and government. Professional and business services; other services; financial activities; construction; and natural resources and mining also added jobs. Information jobs were down over the year, as were jobs in leisure and hospitality and manufacturing.
Exhibit 2: Arizona Net Job Change (Thous.) and 2023 Annual Wages per Worker
Jobs in the Phoenix MSA rose by 49,000 over the year in June, for 2.1% growth. That accounted for 74.0% of state gains.
Over the year, private education and health services jobs were up the most, followed by trade, transportation, and utilities; government; and professional and business services. Information jobs declined the most over the year, followed by leisure and hospitality. The remaining sectors were either up or down slightly (Exhibit 3).
Exhibit 3: Phoenix MSA Net Job Change (Thous.) and 2023 Annual Wages per Worker
The Tucson MSA generated solid job gains in June, rising by 6,000 (or 1.5%). That accounted for 9.1% of state gains.
Job gains were dominated by private education and health services, with other sector generating small gains or losses over the year (Exhibit 4).
Exhibit 4: Tucson MSA Net Job Change (Thous.) and 2023 Annual Wages per Worker
The Prescott MSA added 900 jobs over the year in June, which translated into 1.3% growth. Government added the most jobs, followed by private education and health services; trade, transportation, and utilities; financial activities; and other services. Jobs were down in professional and business services and leisure and hospitality, while jobs in mining and construction; manufacturing; and information were unchanged over the year (Exhibit 5).
Exhibit 5: Prescott MSA Net Job Change and 2023 Annual Wages per Worker