EBRC Research Staff
Current data releases as of 5 July 2024
The Hispanic population grew at a faster rate than the non-Hispanic population between 2022 and 2023 both in the U.S. and in Arizona. The recently released U.S. Census Bureau 2023 population estimates by age, sex, race, and Hispanic origin provided data for the nation, states, counties, and MSAs. Nationally, the Hispanic population increased by 1.8% between 2022 and 2023 while Arizona experienced a 1.9% increase. This is in contrast to a 0.2% increase for the non-Hispanic population in the U.S. and a 0.4% change in Arizona. Within the state, two counties, La Paz and Santa Cruz, had higher growth for the non-Hispanic population in 2023 with the rest following the same pattern as the nation. Nine counties in Arizona are more than twenty percent Hispanic. Arizona’s population changes mirrored the country for most racial and ethnic groups except Black and Asian populations. The Asian population in Arizona had the largest growth in the state at 3.7% over the year compared to 2.3% nationally. The Black population had the second-highest percentage change for the state at 2.4% compared to a 0.6% change in the U.S. One notable population statistic provided in the Census Bureau press release was that Maricopa County had the largest American Indian and Alaska Native (non-Hispanic) population in the nation and was also the largest-gaining county for that group over the year. Additionally, the Phoenix metro area had the largest population of American Indian and Alaska Natives. Arizona has the second-largest American Indian and Alaska Native population among all states, following Oklahoma. –Valorie Rice, EBRC Business Information Specialist
The 2022 County Business Patterns report indicates that there were 5,098 additional establishments in the state in 2022, a change of 3.3%. Most Arizona counties gained establishments over the year, except Gila County, with a decrease of 11. Maricopa County gained the largest number of establishments (3,626), though Pinal County had the largest percent increase at 7.1%. The average annual payroll per employee in 2022 was $58,345 for Arizona, a $1,559 increase over 2021. La Paz County had the lowest average pay at $37,569 on the other side of the state, Greenlee had the highest at $86,507. Health care and social assistance was the sector with the largest increase in establishments over the year, adding 956 in the state, followed by accommodation and food services, which added 669. While it added the second-highest number of establishments in Arizona, accommodations and food services had the lowest average payroll per employee in 2022 at $26,090. Sectors with the highest pay in the state were utilities at $113,323, followed by management of companies and enterprises at $93,618, and mining, quarrying, and oil and gas extraction at $90,376. –Valorie Rice, EBRC Business Information Specialist
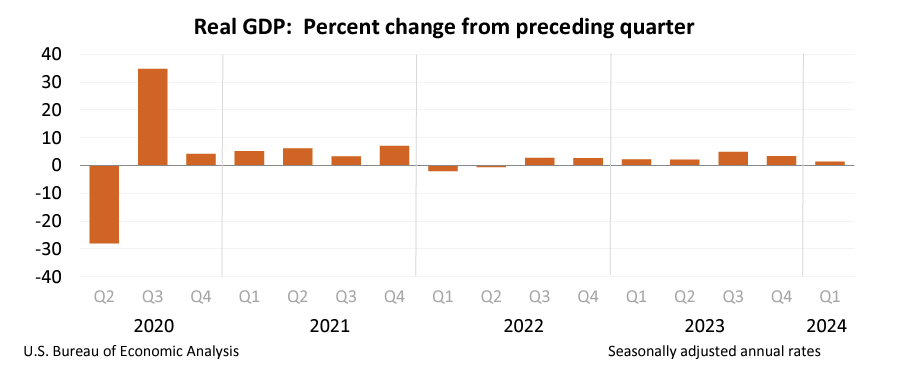
Real gross domestic product (GDP) increased at an annual rate of 1.4% in the first quarter of 2024, according to the third estimate released by the Bureau of Economic Analysis. In the second estimate, the increase in real GDP was 1.3%. This update primarily reflects downward revisions to imports, a subtraction from GDP, and upward revisions to nonresidential fixed investment and government spending. These revisions were partially offset by a downward revision in consumer spending. Current-dollar GDP increased 4.5% at an annual rate, an upward revision of 0.2 percentage points. The personal consumption expenditures (PCE) price index increased 3.4%, a 0.1 percentage point upward revision. Current dollar personal income, disposable personal income, real disposable personal income, and personal savings were all revised down. –Delaney O’Kray-Murphy, EBRC Research Economist
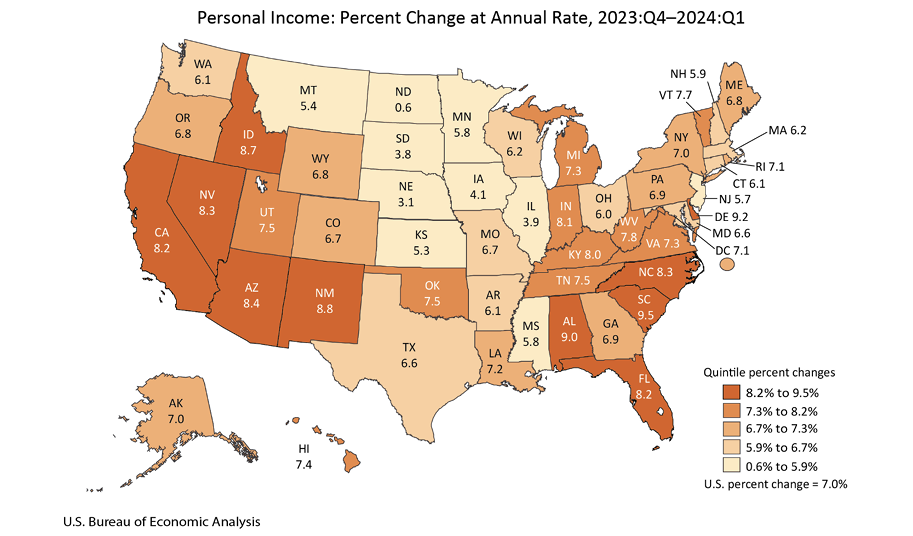
The percent change in real GDP by state ranged from -4.2% in South Dakota to 5.0% in Idaho in the first quarter of 2024, based on the U.S. Bureau of Economic Analysis’ June 28 release. Real GDP in Arizona increased 3.2%, the fourth largest among all states. Real GDP grew 1.4% for the nation for the same period. Construction was the leading contributor to growth in 10 states, including Idaho and Nevada, the top two states for real GDP increases. Arizona was also among the states with an increase in personal income for the first quarter of 2024, with a rise of 8.4%, ranking it sixth. The change in personal income ranged from 0.6% in North Dakota to 9.5% in South Carolina. Nationally, income rose 7.0%, with earnings, transfer receipts, and property income (dividends, interest, and rent) all contributing to the increase. Transfer receipts and property income increased in all 50 states and the District of Columbia, while earnings increased in 47 states. Earnings were lower in North Dakota and South Dakota and unchanged in Iowa, primarily due to farm earnings. –Valorie Rice, EBRC Business Information Specialist
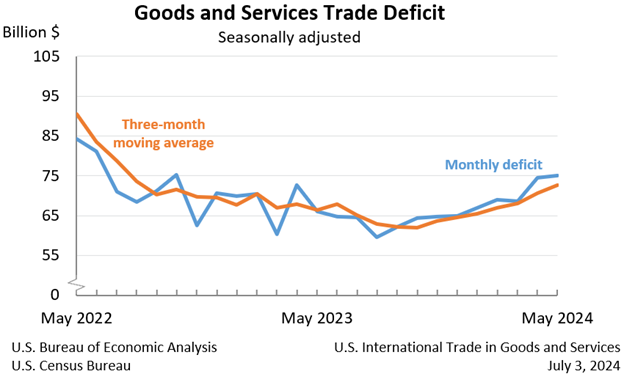
The May goods and services trade deficit came in at $75.1 billion, up $0.6 billion from a revised $74.5 billion in April. May exports fell $1.8 billion to $261.7 billion, and imports similarly fell $1.2 billion to $336.7 billion. The increase in the deficit reflects an increase in the goods deficit of $0.9 billion to $100.2 billion and an increase in the services surplus of $0.3 billion to $25.1 billion. Over the year, the goods and services deficit increased $14.4 billion, or 4.2%, with exports rising 3.4% and imports increasing 3.6%. The largest surpluses, in billions, occurred with Netherlands ($4.1), South and Central America ($3.5), and Australis ($1.9), while the greatest deficits were with China ($23.9), European Union ($19.3), and Mexico ($14.1). –Delaney O’Kray-Murphy, EBRC Research Economist
In May, over the month state unemployment rates were lower in four states, higher in three, and stable in the remaining 43 and the District of Columbia. Arizona’s seasonally adjusted unemployment rate decreased 0.2 percentage points over the month to 3.4%, a new series low. North and South Dakota had the lowest unemployment rates in May at 2.0% each, followed by Vermont at 2.1%. The District of Columbia had the highest unemployment rate, 5.3%, closely followed by California, 5.2%, and Nevada, 5.1%. Arizona and Massachusetts had the only over-the-year decreases, -0.3 percentage points each. Fifteen states had jobless rates that were not significantly different from a year prior. –Delaney O’Kray-Murphy, EBRC Research Economist
The May 2024 release of the Job Openings and Labor Turnover (JOLTS) report stated that the number of job openings in the U.S. changed little to 8.1 million, while the job openings rate was at 4.9%. The industry with the largest increase was in state and local government, excluding education (+117,000). The sector that saw the largest decrease was accommodation and food services (-147,000). The number of hires was 5.8 million, with a rate of 3.6% for May, down from 4.0% in May 2023. Total separations reported for the nation was 5.4 million, with a rate of 3.4%. The number of quits was 3.5 million, and the rate was 2.2% for the seventh consecutive month. The number of layoffs and discharges changed little at 1.7 million, with a rate of 1.0%. –Alex Jaeger, EBRC Web Application Developer
The Yuma unemployment rate decreased by 1.4 percentage points over the year in May, the largest decline out of all metropolitan area unemployment rates in the nation. However, it was also one of five areas with a jobless rate higher than 8.0% in May. There were 91 areas with an unemployment rate below 3.0%, Phoenix being one of those. Nationally, the unadjusted unemployment rate in May was 3.7%, not seasonally adjusted. The lowest jobless rates in the nation were in Burlington-South Burlington, VT, and Sioux Falls, SD, which posted rates of 1.7% each. El Centro, CA, had the highest rate in May at 15.4%. Arizona metropolitan area unemployment rates in May were 3.2% in Flagstaff, 3.8% in Lake Havasu City-Kingman, 2.9% in Phoenix, 3.0% in Prescott, 3.7% in Sierra Vista-Douglas, 3.1% in Tucson, and 11.5% in Yuma. The Arizona unemployment rate before seasonal adjustment was 3.2% for the month. –Valorie Rice, EBRC Business Information Specialist
Phoenix house prices leveled off in April at an annual gain of 4.8%, following an increase of 4.9% in March. Nationally, house prices reflected a gain of 6.3% annually in April based on the S&P CoreLogic Case-Shiller Index. The 20-city composite increased by 7.2% over the year. San Diego continued at the top of the 20-city list with an annual gain of 10.3% for house prices. New York and Chicago were the next highest, with 9.4% and 8.7%, respectively. On the lower end, Portland replaced Denver as the city with the smallest change at 1.7% in April while Denver was at 2.0%. The monthly price change between March and April was 1.2% nationally, and all 20 cities increased over the month. –Valorie Rice, EBRC Business Information Specialist
Arizona continued to rank in the bottom tier of all states for child well-being based on the 2024 KIDS COUNT Data Book. The state had an overall rank of 42 in 2024, down from 39 in 2023. The rankings are based on 16 indicators from four sections. Arizona ranked 33rd for economic well-being, 44th for education, 34th for health, and 41st for the family and community section. Compared to last year’s rankings, Arizona was stable for economic well-being, improved slightly for education, and lost ground for the health category along with family and community. Arizona’s economic well-being statistics were somewhat better than the nation for three of the four indicators, better than the U.S. in two and worse in two health indicators, matched that of the U.S. for one indicator but below in three other family and community indicators, and worse than the nation for all four education indicators. –Valorie Rice, EBRC Business Information Specialist
In May, Arizona over-the-year total building permits saw a slight 1.0% decrease to 4,490, not seasonally adjusted. The number of single-family permits rose 21.3% over the year to 3,861. The Phoenix metropolitan area accounted for most of the permits in the state, with 3,207, a 5.7% over-the-year decrease; however, the number of single-family permits saw solid gains, rising 22.0% to 2740. Inversely, the number of total permits within the Tucson metropolitan area increased 3.3% to 465, while the number of single-family permits decreased 1.8% to 375. Of the counties, Gila, Mohave, Navajo, Pima, Pinal, Santa Cruz, Yavapai, and Yuma all saw increases, while Apache, Cochise, Coconino, Graham, and Maricopa saw decreases. No changes were observed in Greenlee or La Paz. –Delaney O’Kray-Murphy, EBRC Research Economist


