Fourth Quarter 2023 Forecast Update
By George W. Hammond, Ph.D., Director and Research Professor, EBRC
November 2023
2023 Economic Outlook Luncheon Slides in PDF
The Arizona economy continues to churn out solid job, income, and sales gains. The state labor market remains tight, but there are modest signs of softening in the unemployment rate, quit and hire rates, and labor compensation. Inflation in Phoenix has decelerated to the national pace but prices remain well above pre-pandemic levels. Housing permits are on pace to decline this year for both single-family and multi-family activity, driven by higher interest rates and significantly reduced housing affordability.
The baseline outlook calls for Arizona job growth to slow as past interest rate increases reduce national gains. Population growth also slows as net migration returns to more normal levels after a pandemic-driven surge. Sales growth declines as consumers react to slowing job growth and increased interest rates. Overall, Arizona is well positioned to grow next year but at a reduced pace.
Arizona Recent Developments
Arizona lost 1,200 seasonally-adjusted jobs over the month in October, its first monthly drop since July. The state added a revised 4,700 jobs in September, down from the preliminary estimate of 8,200.
Over the month in October, professional and business services dropped 3,200 jobs, followed by financial activities (down 2,600), leisure and hospitality (down 2,000), other services (down 800), manufacturing (down 300), information (down 300), and construction (down 100).
Partially offsetting those declines were gains in private education and health services (up 4,400), trade, transportation, and utilities (up 2,500), government (up 1,100), and natural resources and mining (up 100).
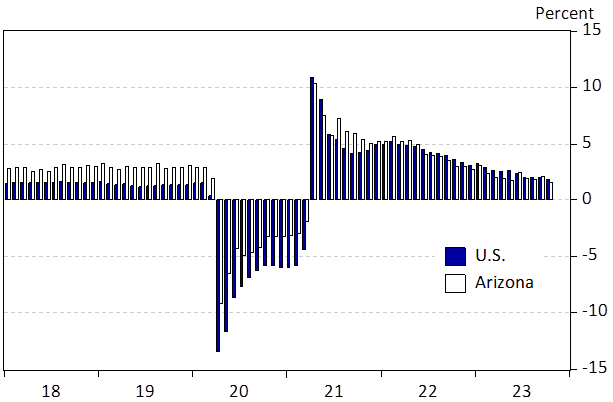
Over the year, Arizona jobs were up 51,100, which translated into a 1.6% increase (Exhibit 1). That was below the U.S. pace of 1.9%. Phoenix MSA jobs were up 1.7% in October and Tucson jobs were up 1.1%.
Exhibit 1: Arizona and U.S. Over-the-Year Job Growth, Nonseasonally Adjusted, Percent
Arizona’s seasonally-adjusted unemployment rate ticked up to 4.2% in October, up from 4.0% in September and up from 3.4% in April and May. The state rate was modestly above the U.S. at 3.9%.
Arizona personal income growth decelerated modestly in the second quarter of 2023, with over-the-year growth decelerating to 6.6%, down from 7.3% in the first quarter. That outpaced the U.S. at 4.8% and the Phoenix MSA rate of inflation of 5.8%.
Growth in the second quarter was driven by net earnings from work, which includes wages and salaries, proprietor’s income, and fringe benefits, less contributions for social insurance and adjusted for commuting. Arizona net earnings rose 6.1% in the second quarter, up from 5.6% in the first quarter.
Dividends, interest, and rent rose 9.2% over the year in the second quarter, down from 12.6% in the first quarter. Transfer income, which includes Social Security, Medicare, Medicaid, welfare payments, and other non-market income, rose 5.7% over the year, down from 7.1% in the first quarter.
Phoenix house prices have risen modestly this year. The median house price in Phoenix was $468,000 in October, up 0.6% over the year. Even so, the Phoenix median price was down 8.2% from its recent peak of $510,000 in May 2022. The Phoenix Case-Shiller Index (a measure of repeat sales of single-family homes) shows that Phoenix home prices were down 3.9% over the year in August and down 6.1% from their peak in June 2022.
Tucson home prices have remained firm this year. The median home price in Tucson was $379,500 in October, down from $381,000 in May but up 5.4% over the year. In contrast to Phoenix, the median home price in Tucson has increased from mid-2022.
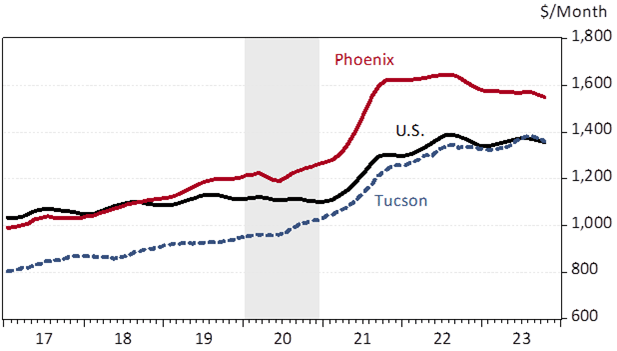
Like home prices, rent skyrocketed during the pandemic. Nationally, median new-lease rent (from Apartment List) rose by 21.2% from February 2020 to October 2023. Rent rose faster in Phoenix and Tucson, with increases of 27.1% and 42.0%, respectively. As Exhibit 2 shows, the rent acceleration was particularly noticeable during 2021 and rent growth has softened since. Over the year in October, rent was up 2.0% in Tucson, reaching $1,359. At $1,354, rent was down 1.2% nationally and Phoenix rent was down 4.3% to $1,547.
Exhibit 2: Rent Growth Has Softened Nationally and In Phoenix and Tucson, Monthly Rent, Apartment List
Single-family housing affordability continued to deteriorate in the third quarter, according to data from the National . Nationally, 37.4% of the homes sold were affordable for a family making the median income. That was down from 63.2% in the last quarter of 2019, or 25.8 percentage points. The drop was bigger in Phoenix, Tucson, and Prescott. In Phoenix, 24.9% of homes sold were affordable, down from 64,9% in the last quarter of 2019. In Tucson, 33.8% of homes sold were affordable, down from 71.2%. For Prescott, the share of affordable homes was down 35.0%, from 55.9% in the last quarter of 2019 to 20.9% in the third quarter of 2023.
Total housing permits in Arizona are on pace to drop 11.0% over the year through the first ten months of 2023. The majority of the decline was driven by single-family permits, down 12.8%, but multi-family permits were down as well, by 7.9%. Keep in mind that these calculations use 2022 data that are benchmarked to the revised annual U.S. Census Bureau data (and that differs from the raw monthly data you see from most sources).
Phoenix housing permits declined 8.9% over the year through the first ten months, with single-family activity down 12.0% and multi-family activity down 4.4%.
The story was similar in Tucson, with total permits down 11.1%, single-family permits down 4.6% and multi-family permits down 24.3%.
Consumer price inflation for all items in Phoenix has decelerated to just below the national rate. In October, prices rose 2.9% over the year in Phoenix. Nationally prices were up 3.2%. That was down significantly from peaks last summer of 13.0% and 9.1% for Phoenix and the U.S., respectively.
While inflation has come down from recent peaks that does not mean that consumer prices have declined. Quite the opposite (Exhibit 3). In Phoenix, the consumer price index for all items was up 24.4% from October 2019 to October 2023. Core prices were up 23.7%. Commodities prices were up 17.3%, while services prices were up 28.6%. Finally, shelter prices were up 41.1%. In nearly every case, prices have risen more in Phoenix than nationally.
Exhibit 3: Consumer Prices Are Far Above Pre-Pandemic Levels, U.S. and Phoenix MSA, Nonseasonally-Adjusted, Percent Change from October 2019-October 2023
Arizona Outlook
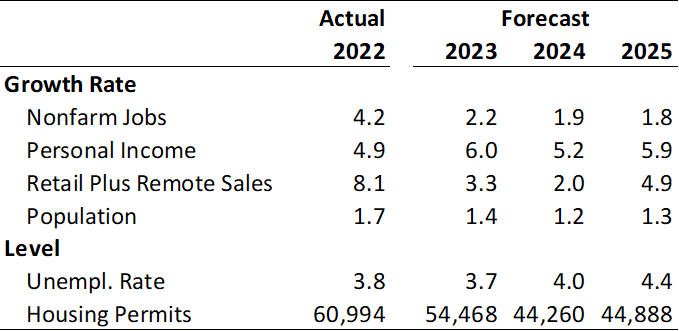
Continued, but softer, U.S. growth sets the stage for continued solid gains in Arizona (Exhibit 4). The forecast calls for Arizona jobs to rise by 2.2% in 2023 (annual average basis), 1.9% in 2024, and 1.8% in 2025. That is close to the U.S. rate in 2023 and well above the U.S. in 2024 and 2025.
Population growth slows from 1.7% in 2022 to 1.4% in 2023 and 1.2% in 2024, as net migration falls from its pandemic surge. The aging of the baby boom generation weighs on natural increase (births minus deaths), which leaves net migration as the major source of population gains.
Personal income growth accelerates in 2023 to 6.0% over the year, up from 4.9% in 2022. Growth slows modestly in 2024, reflecting softer gains in dividends, interest, and rent as well as transfer income.
Retail plus remote sales growth is expected to slow from 8.1% in 2022 to 3.3% in 2023 and 2.0% in 2024, before accelerating to 4.9% in 2025. The softening reflects both the post-pandemic normalization of consumer spending across goods and services as well as slowing income and job gains.
Housing permits are forecast to drop from 60,994 in 2022 to 54,468 in 2023 and again in 2024 to 44,260. That reflects both decelerating population gains as well as significantly reduced housing affordability.
Exhibit 4: Arizona Outlook Summary
Growth in Phoenix and Tucson follows the same pattern as the state and the nation. Phoenix job growth is forecast to decelerate from 4.4% in 2022 to 2.4% in 2023 and 2.2% in 2024. Population growth slows from 1.9% in 2022 to 1.6% in 2023 and 1.5% in 2024 as net migration slows.
Tucson job growth falls from 3.2% in 2022 to 1.6% in 2023 and again to 1.5% in 2024. Population growth decelerates from 1.3% in 2022 to 0.8% in 2023 and 0.6% in 2024.
VIEW MOST RECENT FORECAST DATA FOR ARIZONA, PHOENIX, AND TUCSON
If your business or organization requires more timely and in-depth forecast data and analysis, find out about the benefits of joining EBRC’s Forecasting Project and email EBRC director George Hammond at ghammond@arizona.edu.
Copyright 2023 Economic and Business Research Center, The University of Arizona, all rights reserved.


