Delaney O’Kray-Murphy, EBRC Research Economist
Comparing housing climates in the post-pandemic era
The landscape of homebuying in the U.S. has been profoundly reshaped in recent years, reflecting evolving preferences and realities introduced by the Covid-19 Pandemic. Pressured by rising costs and interest rates, migrants travel across the nation to look for affordable housing. This article embarks on an exploration of the current highest and lowest ranked metro areas that homebuyers are vacating and relocating to, shedding light on the evolving preferences and priorities that underpin these decisions. Drawing upon a comparison of mobility data from the early post-pandemic era to the present, we unravel the dynamic narratives that continue to shape the American housing landscape.
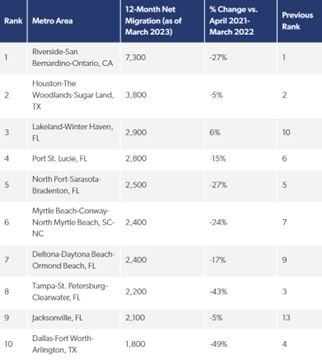
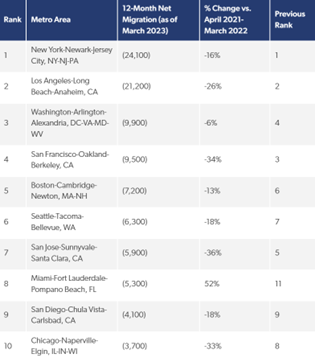
In the immediate aftermath of the pandemic, a surge in migrating homebuyers marked a remarkable shift, with numbers surging by more than threefold between March 2020 and March 2022, according to a Freddie Mac article on the latest homebuyer trends. Although the pace of outbound migration from metropolitan areas has tapered off, registering an 18% decline in the 12-month period ending March 2023, the pursuit of affordable housing remains a driving force. Exhibit 1a provides insights into the top ten metros experiencing net migration gains, with Riverside-San Bernardino-Ontario, CA, leading the pack, boasting a 12-month net migration of 7,300 individuals. Conversely, Exhibit 1b paints a contrasting picture, revealing the nation’s ten largest metros grappling with net migration losses, with the New York metro area experiencing the most substantial decline, standing at -24,100 net migration. Notably, Arizona did not secure a position among the top ten for migration gains or losses.
Exhibit 1a: Metro Areas With the Largest Net Migration Gains, April 2022-March 2023
Exhibit 1b: Metro Areas With the Largest Net Migration Losses, April 2022-March 2023
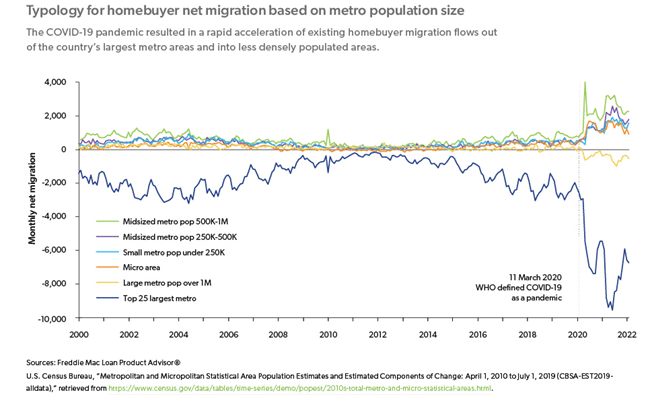
The migration landscape immediately following the pandemic exhibited a notable transformation, with homebuyers gravitating away from larger metropolitan areas and towards smaller, often more affordable locales. Sourced from a Freddie Mac article discussing post-pandemic migration trends, Exhibit 2 emerges as a compelling visual testament to this shift. This exhibit provides an insightful view of net migration trends based on metro population size, underscoring the dramatic increase in the number of individuals departing from the largest metropolitan areas. Simultaneously, it illuminates the corresponding rise in net in-migration towards smaller, often more accessible regions.
Exhibit 2: Typology for Homebuyer Net Migration Based on Metro Population Size, 2000-2022
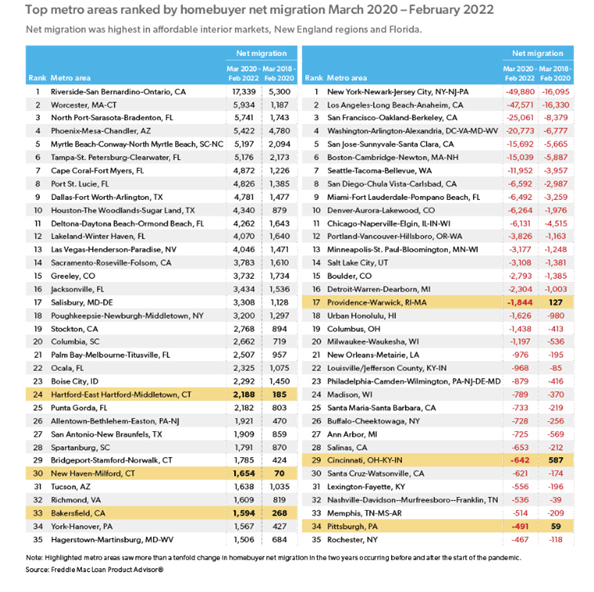
Exhibit 3 offers a unique snapshot, depicting the top metro areas ranked by homebuyer net migration between March 2020 and February 2022. Notably, this exhibit unveils a distinct narrative where the largest migration losses are observed in inelastic coastal markets characterized by high prices, such as New York, Los Angeles, and San Francisco. Additionally, it is intriguing to observe several Arizona locations in this exhibit, featuring notably high positive net migration numbers. Phoenix, for instance, secured the fourth position in net inflow, with Tucson following closely at 31st. It is worth emphasizing that the data in Exhibit 3 diverges from the more current insights presented in Exhibits 1a and 1b, which showcase the latest trends in the top ten gainers and losers of net migration.
Exhibit 3: Top Metro Areas Ranked by Homebuyer Net Migration March 2020 – February 2022
In our exploration of shifting homebuying trends, we have harnessed the invaluable insights provided by both historical and recent Freddie Mac data. This dual perspective has allowed us to chart the evolution of migration patterns in the United States, shedding light on the enduring impacts of the pandemic and the dynamic factors that influence where Americans choose to call home. Freddie Mac, the Federal Home Loan Mortgage Corporation, plays a pivotal role in the U.S. housing finance system. Established with the mission to promote homeownership and stability in the housing market, Freddie Mac operates as a key player in the mortgage industry. Through their Loan Product Advisor (LPA), a sophisticated automated underwriting system, Freddie Mac not only streamlines the loan application process but also compiles data that offers a real-time view of the residential mobility of American homebuyers. Notably, these data only capture the intent to move and only capture data on loan applications sent to Freddie Mac, excluding government-backed loans, non-conforming loans, and conventional conforming loan applications not submitted to Freddie Mac. As we navigate the intricate terrain of housing trends, Freddie Mac’s data helps outline the ever-evolving choices that define the American housing landscape.


