Second Quarter 2023 Forecast Update
By George W. Hammond, Ph.D., Director and Research Professor, EBRC
June 2023
2023 Breakfast with the Economists Presentation Slides in PDF
The Arizona economy started 2023 in solid shape. The labor market generated strong job growth and low unemployment. Labor compensation decelerated at the end of 2022 and into early 2023 but remained robust. Even so, rapid inflation continued to chew up wage gains. In addition, retail sales declined again in the first quarter, after a strong increase in the fourth quarter of 2022. With plummeting housing affordability and much higher mortgage interest rates, housing permit activity plummeted in late 2022 and into early 2023, driven by declines in single-family activity.
The outlook calls for Arizona’s economic growth to slow in 2023 and 2024 but to avoid recession and outpace the nation. However, risks to the baseline forecast remain elevated. Under the pessimistic scenario, the U.S. economy succumbs to shocks originating in the financial sector, as recent bank failures cause much more financial tightening than expected under the baseline. This generates modest job losses in the state, but nothing like the state’s experience during the 2007-2009 period.
Arizona Recent Developments
In April 2023, Arizona jobs were 165,000 above their pre-pandemic peak. Nearly all industries in the state were above their pre-pandemic level in April, with the exception of government and other services.
For the Phoenix MSA, jobs were up by 151,700 from February 2020 to April 2023, accounting for the majority of the state increase. Government jobs in Phoenix remained significantly below their pre-pandemic level, while other services and natural resources and mining were close to full recovery. Most other sectors were well above February 2020 levels.
Jobs in the Tucson MSA have risen by 3,800 from February 2020 to April 2023, with much more varied performance across industries than for the state or Phoenix. Private education and health services jobs were 2,800 jobs below February 2020 and professional and business services jobs were 2,200 below. Both sectors performed much better in the Phoenix MSA, for reasons which are very unclear.
Similar to Phoenix, Tucson jobs in trade, transportation, and utilities; financial activities; construction; and manufacturing were well above their pre-pandemic level in April.
In April, the Arizona seasonally adjusted unemployment rate dropped to 3.4% (preliminary), an all-time low going back to 1976. Arizona’s rate was equal to the national rate in April.
Arizona’s tight labor market is putting upward pressure on employment costs, which include both wages and salaries and employer-paid fringe benefits. In the first quarter of 2023, Phoenix employment costs for private industry workers rose by 4.6% over the year, up slightly from 4.4% in the fourth quarter but below the national average of 4.8%. While the increase in Phoenix employment costs has moderated modestly, it is still higher than at any time in the past decade. Even so, employment costs are not keeping pace with Phoenix inflation, which hit 8.5% over the year in the first quarter.
Inflation continued to moderate both nationally and in the Phoenix MSA in April. Over the year, the all-items CPIU rose 4.9% nationally. It was up 7.4% in Phoenix. The U.S. inflation rate peaked in June 2022 at 9.1% over the year. The Phoenix inflation rate peaked at 13.0% in August.
Phoenix inflation is outpacing the U.S. primarily because the cost of shelter has been rising much faster. In April, the shelter consumer price index for the Phoenix MSA was up 14.2% over the year and the national index was up 8.1%. In contrast to the U.S., shelter inflation in Phoenix has moderated significantly from its peak of 19.5% in September 2022 (estimated based on interpolated data).
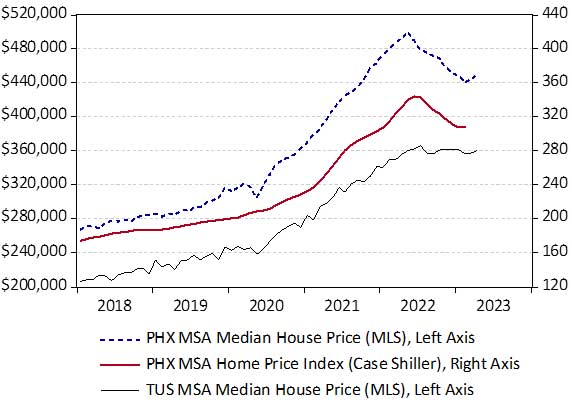
Phoenix shelter inflation has moderated significantly because house prices have declined from their peak last summer. Median home prices in Phoenix dropped 10.7% from their peak of $510,000 in May 2022 to $455,400 in April 2023 (Exhibit 1). Using the Phoenix Case-Shiller index (which tracks repeat sales of single-family homes over time), the decline was 10.4% from the peak in June 2022 to February 2023.
Tucson median home prices declined from a peak of $370,000 in June/July 2022 to $365,000 in April 2023, a decline of 1.4%.
Exhibit 1: House Prices Continued to Decline During Early 2023, Median Sales Price for Phoenix and Tucson and Case-Shiller for Phoenix, Seasonally Adjusted
Arizona seasonally adjusted total housing permits dropped again in the first quarter of 2023. That was the fourth consecutive decline. Total permits were down 31.0% over the year in the first quarter, compared to benchmarked 2022 data. Permits posted a 24.8% drop in the fourth quarter. Single-family permits drove the decline during the past year, with a 42.3% decline in the fourth quarter and a 47.7% drop in the first quarter of this year. In contrast, multi-family permits were up 7.6% in the fourth quarter and up 8.0% in the first quarter of 2023.
Based on revised annual data from the U.S. Census Bureau, Arizona posted 60,994 total permits in 2022. That was down 6.6% from 2021. The decline was driven by single-family permits, which fell by 19.8% in 2022. Multi-family permits were up 26.0% for the year.
Total housing permits in the Phoenix MSA dropped from 50,581 in 2021 to 47,267 in 2022, a 6.6% decline. Again, the decline was completely driven by single-family permits, which fell by 21.8%. Multi-family permits increased by 25.7%.
The story was similar for the Tucson MSA, where total permits fell from 6,284 in 2021 to 5,714 in 2022. That translated into a decline of 9.1%. Single-family permits declined by 27.0% while multi-family permits rose by 69.4%.
Arizona Outlook
The forecasts for Arizona, Phoenix, and Tucson depend on the outlook for the global and national economies. The forecasts presented here are based on U.S. projections released by S&P Global in April 2023.
After increasing by 2.1% in 2022, the baseline forecast calls for U.S. real GDP growth to slow to 1.4% in 2023 and 1.5% in 2024. The economy is projected to be slightly stronger than expected last month, reflecting stronger recent growth.
On a quarterly basis, the forecast calls for real GDP to decline by 0.4% in the second quarter of 2023 before posting positive gains through the remainder of the year. The drop in the second quarter reflects the impact of tightening financial conditions (created by recent bank failures) on economic activity.
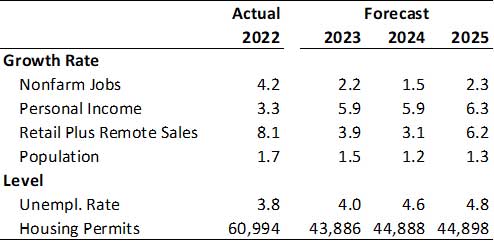
A slowing national economy will mean slower growth in Arizona. Exhibit 2 shows that Arizona’s job growth is forecast to slow from 4.2% in 2022 to 2.2% in 2023 and then again to 1.5% in 2024. Even so, the pace of state job growth is expected to far outpace the nation.
Exhibit 2: Arizona Outlook Summary
With the end of pandemic-related income support in 2021, Arizona personal income growth decelerated to 3.3% over the year in 2022. Gains return to normal in 2023, as labor market remain tight, interest rates remain elevated, and transfer income increases.
Retail sales growth (including remote sellers) decelerates from 8.1% in 2022 to 3.9% in 2023 and again to 3.1% in 2024, reflecting slower job gains and increased economic uncertainty.
Strong net migration related to the pandemic drove population growth of 1.7% in 2022. As the boost to net migration from the pandemic wanes, population growth is forecast to decelerate to 1.5% in 2023 and 1.2% in 2024.
The state labor market is forecast to remain tight this year, with the unemployment rate expected to rise from 3.8% in 2022 to 4.0% in 2023. As job growth decelerates in 2024, the unemployment rate increases to 4.6%.
Arizona total housing permits are forecast to decline from 60,994 in 2023 to 43,886 in 2023, reflecting rising significantly higher mortgage interest rates and lower housing affordability. Permits bounce up modestly in 2024 and then settle in at a pace consistent with population change.
Risks to the Outlook
The baseline U.S. forecast from S&P Global assumes no U.S. recession this year or next. However, risks to the baseline forecast remain elevated.
Under the pessimistic scenario, the U.S. economy succumbs to shocks originating in the financial sector, as recent bank failures cause much more financial tightening than expected under the baseline.
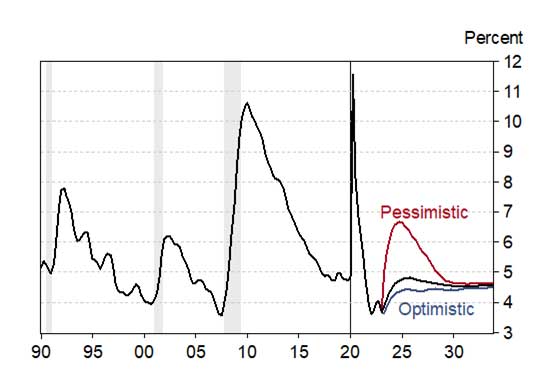
A national downturn would significantly slow Arizona job growth and increase the unemployment rate (Exhibit 3). As the exhibit shows, the increase in unemployment is expected to be fairly modest compared to what Arizona went through during the Great Financial Crisis, the pandemic, and even the downturn during the early 1990s.
Exhibit 3: Arizona’s Unemployment Rate Spikes in the Pessimistic Scenario, Three Scenarios for Arizona Unemployment, Seasonally Adjusted, Percent
VIEW MOST RECENT FORECAST DATA FOR ARIZONA, PHOENIX, AND TUCSON
If your business or organization requires more timely and in-depth forecast data and analysis, find out about the benefits of joining EBRC’s Forecasting Project and email EBRC director George Hammond at ghammond@arizona.edu.
Copyright 2023 Economic and Business Research Center, The University of Arizona, all rights reserved.


