Valorie Rice, Senior Business Information Specialist
Shaw Zeider, Research Assistant
EBRC student researchers Prarthana Magon and Utsav Kataria
Current data releases as of 21 April 2023
The Consumer Price Index for All Urban Consumers increased by 0.1% (adjusted) in March, following a 0.4% increase in February. On an annual basis, inflation was 5% in March, down from 6% in February (unadjusted), the smallest annual gain since May 2021. The sector that contributed the most towards the increase for the month was shelter, while energy declined by 3.5% over the past month. The 0.6% increase in shelter costs was the smallest since November but is still up by 8.2% annually. Food prices remained constant. Egg prices, which had been soaring, are down by 10.9% for the month but still up 36% annually. The index for all items less food and energy increased by 0.4% monthly and 5.6% annually. Used vehicle prices, which led to high inflation in 2021, declined 0.9% over the month for March and 11.2% annually.
In March 2023, the Producer Price Index decreased by 0.5% monthly (seasonally adjusted). This was slightly unexpected to forecasters as a small increase was projected. The decline is positive news as increased prices for producers eventually lead to increased prices for consumers. As the prices decline, the economy will start cooling off. Final demand prices increased by 2.7% annually (nonseasonally adjusted). This 2.7% annual increase is the lowest level seen in the past 2 years. The decline was mainly driven by decreased energy prices as the index for final demand energy dropped by 6.4% in March. The prices for final demand services fell by 0.3% as well this month. A 7.3% drop in March in margins for machinery and vehicle wholesaling contributed to this decrease. The prices for vegetables went down, while the prices of light motor trucks, eggs, and meats increased.
According to the Job Openings and Labor Turnover Survey April 4 release for the U.S., there were 9.9 million job openings in February 2023 in the U.S., a decrease of 632,000 from January. Professional and business services saw the largest decrease in job openings, followed by healthcare and social assistance and transportation, warehousing, and utilities. The number of job openings increased in construction and arts, entertainment, and recreation. The number and rate of hires in the U.S. for February remained relatively stable, with a reported 6.2 million hires and a rate of 4.0 percent. The number of total separations changed little at 5.8 million, with the rate changing slightly to 3.7%. Total separations decreased in transportation, warehousing, and utilities but increased in educational services. The number of quits edged up to 4.0 million, and the rate changed slightly, reporting at 2.6%. The number of layoffs and discharges decreased to 1.5 million, with the rate decreasing slightly to 1.0%.
According to the recent release of the Job Openings and Labor Turnover Survey, Arizona had a total of 181,000 job openings in February 2023, which is a decrease of 23.6% compared to the same period last year. This was the lowest reported number since January 2021. The number of hires for the month was 136,000, down 9.9% from the previous year, while total separations were reported at 124,000, which was a decrease of 9.5% over the year. The decline in separations was largely driven by a 15.5% decrease in total quits, which came in at 87,000. However, layoffs and discharges increased by 14.8% over the year to 31,000, reflecting the mass layoffs that occurred earlier this year. The number of unemployed residents in Arizona increased by 5.1% over the year to 134,836.
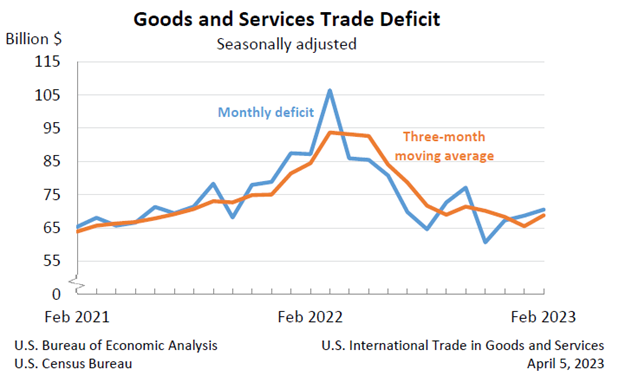
The February U.S. trade deficit was $70.5 billion, up $1.9 billion over the revised January figure of $68.7 billion. Despite increasing between January and February, the year-to-date goods and services deficit was down 20.3% from the same period in 2022 based on the joint U.S. Census Bureau and U.S. Bureau of Economic Analysis April 5 release. Both exports and imports were down in February. Exports were $251.2 billion, down $6.9 billion from January while imports stood at $321.7 billion, $5.0 billion less than January.
U.S. total nonfarm employment grew 236,000 in March, lower than the average monthly gain over the last six months of 334,000. Leisure and hospitality, government, professional and business services, and health care all had notable job gains. The seasonally adjusted unemployment rate for the nation was 3.5% in March, which has changed little since early 2022 based on the April 7 U.S. Bureau of Labor Statistics release. The labor force participation rate continues to tick up, at 62.6% for the month compared to 62.5 in February, though is still below pre-pandemic levels.
The March 2023 seasonally adjusted unemployment rate for Arizona was 3.5%, matching the national unemployment rate of 3.5%. Month over month, Arizona not-seasonally adjusted (NSA) total nonfarm employment decreased by 9,800 jobs. Total nonfarm employment increased by 62,600 jobs over the year, or 2.0% before seasonal adjustment. On a year-over-year basis, private education & health services was the sector with the largest employment increase by far at 23,200 jobs gained. Arizona metropolitan area annual job gains in March before seasonal adjustment were 2.5% in Prescott, 2.3% in Phoenix, 2.3% in Flagstaff, 0.9% in Tucson, 0.0% in Sierra Vista-Douglas, -0.2% in Lake Havasu City-Kingman, and -1.3% in Yuma.
Arizona was among the states with a significant year-over-year change in employment for March, with a seasonally adjusted increase of 2.2%. Nevada had the largest percent increase out of all states at 5.0% according to the April 21 U.S. Bureau of Labor Statistics State Employment and Unemployment release. Arizona had the smallest increase among western states with Texas increasing 4.3%, Idaho 3.0%, New Mexico 2.8%, Oregon 2.8%, Utah 2.8% and California 2.5%.


