Valorie Rice, Sr. Business Information Specialist
Current data releases as of 25 March 2022
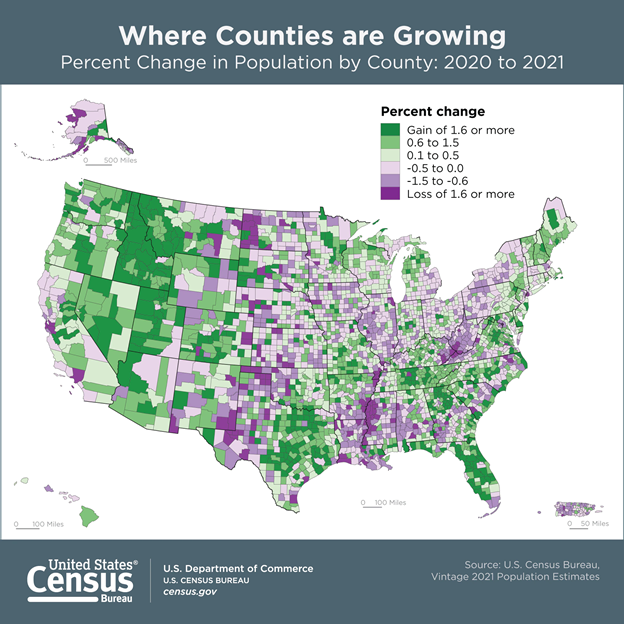
Most counties in the U.S. experienced natural decrease in 2021 according to the most recent U.S. Census Bureau population estimates release. Population change is comprised of two variables – natural increase (births minus deaths) and net migration. When the number of deaths surpass the number of births there is natural decrease, which was the case in 2,297 of the nation’s 3,143 counties in 2021, more than 73 percent (compared to 45.5 percent in 2019). There were eight counties in Arizona with natural decrease between 2020 and 2021 – Apache, Cochise, Gila, La Paz, Mohave, Navajo, Pima, and Yavapai. Positive net migration can offset this, providing overall population growth, so of the eight counties only Apache and La Paz had negative population growth. More people moving out of the area than moving in resulted in population decline in Coconino and Greenlee counties. Apache was the only county to experience a double whammy of decreases in both natural change and net migration though the overall decrease (-0.4 percent) was not as severe as other counties in the state. Most counties in Arizona had population gains over the year. In fact, Maricopa County had the largest numeric change in population of all counties in the U.S., with an increase of 58,246 residents. Maricopa was also the fourth most populous county in the nation for 2021. Population changes in Arizona counties ranged from -1.2 percent in Greenlee to 4.6 percent in Pinal. Pinal, Yavapai, and Mohave counties had the population increases higher than the state growth of 1.4 percent. Population increases in both Maricopa and Pinal lead to the Phoenix-Mesa-Chandler MSA having the second largest numeric increase among metropolitan areas, behind only Dallas-Fort Worth-Arlington, TX. The Phoenix-Mesa-Chandler MSA also had the largest net domestic migration gains among all metropolitan areas.

The U.S. Census Bureau released the 2016-2020 American Community Survey (ACS) 5-year estimates on March 17. In 2020, the median household income for Arizona was $61,529 compared to $64,994 for the U.S. The inflation-adjusted median income in Arizona counties ranged from $33,967 in Apache County to $67,799 in Maricopa County. The poverty rate in Arizona dropped from 18.2 percent in 2015 to 14.1 percent in 2020. There were four counties with a smaller percentage of people in poverty than the state in 2020, Pinal (12.1 percent), Yavapai (12.6 percent), Maricopa (12.7 percent) and Greenlee (13.3 percent). The percent of the population 25 years and over with a bachelor’s degree or better was 30.3 percent in Arizona in 2020, an improvement of 2.8 percentage points from 2015. Three counties had higher educational attainment than the state in 2020, Maricopa at 33.4 percent, Pima at 33.6 percent and Coconino at 37.6 percent. These counties also had increases of three percentage points or higher between 2015 to 2020 and are the locations for the three state universities.
Arizona nonfarm employment increased 4.4 percent over the year in February, a gain of 126,900 jobs. According to the Arizona Office of Economic Opportunity March 24 release, over the year employment increases for Arizona metropolitan areas were 10.4 percent in Flagstaff, 5.1 percent in Prescott, 4.7 percent in Lake Havasu City-Kingman, 4.6 percent in Tucson, 4.1 percent in Phoenix, 2.9 percent in Yuma, and 0.6 percent in Sierra Vista-Douglas. Leisure and hospitality was the sector with the largest over the year increase, adding 43,100 jobs for a gain of 15.3 percent. Leisure and hospitality gained 17.4 percent in the U.S. during that same period. All sectors had employment increases from February to February. Arizona’s seasonally adjusted unemployment rate was down to 3.6 percent in February, the lowest it had been since August 2007.
At 3.6 percent, Arizona was among 18 states with unemployment rates lower than the U.S. figure of 3.8 percent in February. Arizona was also among 31 states with decreased unemployment rates for February, the other 19 were unchanged according to the March 25 state employment report from the U.S. Bureau of Labor Statistics. Nebraska and Utah had the lowest rates, both with 2.1 percent. There were nine states posting new series lows, among them were Nebraska, Utah, Indiana, Kansas, Arkansas, Mississippi, Montana, Oklahoma, and West Virginia. The highest jobless rate was in the District of Columbia at 6.1 percent followed by New Mexico at 5.6 percent.
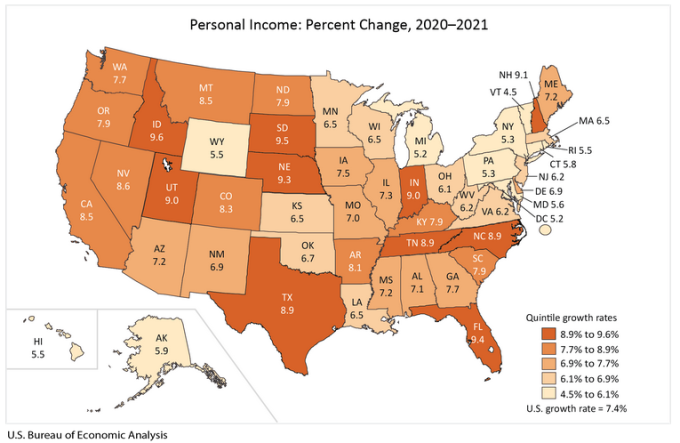
Personal income increased 7.2 percent in Arizona in 2021, just below the U.S. increase of 7.4 percent. The March 23 state personal income release from the Bureau of Economic Analysis indicated the percent change in personal income for 2021 ranged from 4.5 percent in Vermont to 9.6 percent in Idaho. Earnings accounted for most of the increase in personal income for the nation, rising 8.9 percent. Transfer receipts increased 8.4 percent in 2021 after increasing 35.1 percent in 2020.

Arizona house prices increased the most out of all states in 2021 according to the Federal Housing Finance Agency fourth quarter 2021 House Price Index, released February 22. The one-year change in purchase-only house price appreciation for Arizona in the fourth quarter 2021 was 27.4 percent, outpacing Utah at 27.1 percent and Idaho at 27.0 percent. The U.S. figure was 17.5 percent with all states and the District of Columbia having positive appreciation over the year. Looking at metropolitan areas using the all-transactions index (estimated using both sales price and appraisal data), several Arizona metro areas ranked within the top 20 for one-year change. Phoenix ranked 11th with a 29.3 percent change, followed by Lake Havasu City-Kingman at 16th with a 27.2 percent change, Prescott Valley-Prescott at 18th with a 26.8 percent change, and Flagstaff at 19th with a 26.8 percent change. Price changes for other Arizona metro areas were 24.8 percent for Yuma (ranked 27th), 24.6 percent for Tucson (ranked 29th) and 20.6 percent for Sierra Vista-Douglas (unranked).


