by Valorie H. Rice
Senior Specialist, Business Information
Current data releases as of 12 June 2020
House price appreciation in Arizona ranked seventh out of all states between the first quarter 2019 and first quarter 2020 at 8.5 percent according to the FHFA House Price Index released May 26. In comparison, the U.S. seasonally adjusted growth during the same period was 5.7 percent. The top seven states with the largest over-the-year increase in house prices were all in the West: Idaho, Montana, Wyoming, Utah, Hawaii, Washington, and Arizona. Idaho’s house prices increased 12.6 percent. Two states, Alaska and West Virginia, had negative growth. Metropolitan area data are available for the all-transactions index, which includes purchase and refinance mortgages. One-year home price increases in Arizona metro areas for the first quarter 2020 were Sierra Vista-Douglas 7.9 percent, Yuma 7.7 percent, Lake Havasu City-Kingman 7.6 percent, Phoenix-Mesa-Chandler 7.5 percent, Flagstaff 6.6 percent, Prescott Valley-Prescott 6.1 percent, and Tucson 6.0 percent.
A similar result was reported by S&P CoreLogic Case-Shiller in a May 26 press release with this index revealing an 8.2 percent increase in Phoenix house prices during the month of March on a year-over-year basis. This was the tenth consecutive month that Phoenix has topped over-the-year gains in house prices among cities. Seattle had the second highest price gain in March at 6.9 percent. Chicago was the city with the lowest price gain at 1.5 percent. Detroit was excluded from the report for the month because transaction records were unavailable due to COVID-19. The U.S. national price index rose 4.4 percent in March compared to 4.2 percent in February.
The U.S. Consumer Price Index (CPI-U) decreased 0.1 percent in May on a seasonally adjusted basis according to the U.S. Bureau of Labor Statistics June 10 release. Gasoline prices remained lower resulting in a decreased energy index. Indexes for motor vehicle insurance and apparel also declined while food and shelter indexes rose. The index for all items less food and energy declined 0.1 percent, making this the third month in a row the index has gone down, something that has not happened before. The annual inflation rate was 0.1 percent for May.
The U.S. trade deficit rose $7.1 billion in April to $49.4 billion. Both imports and exports were lower for the month due in part to COVID-19 restrictions according to the June 4 joint U.S. Census Bureau and U.S. Bureau of Economic Analysis release. Exports were down $38.9 billion while imports were $31.8 billion less than March. Year-to-date the deficit of goods and services is down 13.4 percent from the same period in 2019.
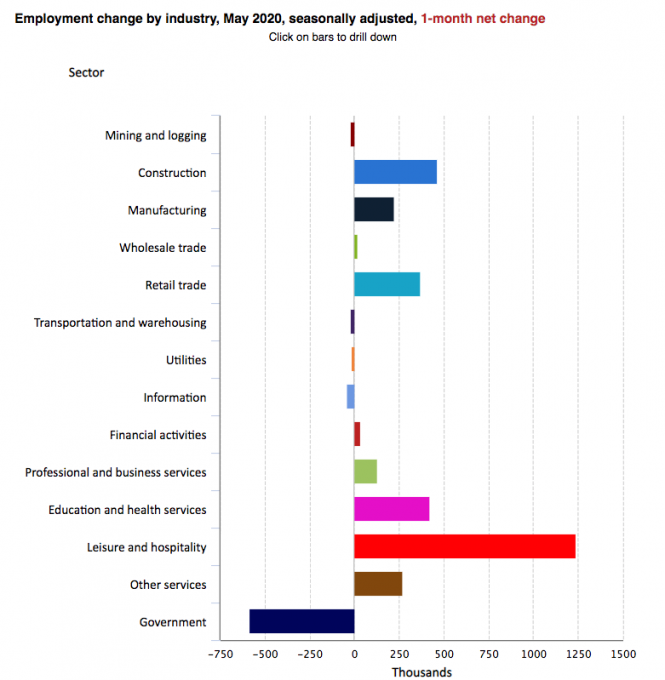
Total U.S. nonfarm employment added 2.5 million in May after dropping 20.7 million in April according to the Employment Situation May 2020 report released from the Bureau of Labor Statistics on June 5. March and April employment data were revised downward and after revisions, job losses averaged 6.5 million per month for the last three months. For the month of May, leisure and hospitality, construction, education and health services, and retail trade all made large increases but government continued to decline. The unemployment rate decreased to 13.3 percent for the month. The employment-to-population ratio increased from 51.3 in April to 52.8 in May.

May bankruptcy filings in Arizona totaled 1,137. This was far fewer than the same time last year, a 23.8 percent decrease over-the-year for May. The number of bankruptcies decreased the most in Maricopa and Pima counties compared to the same month a year ago. Year-to-date, bankruptcies are down 15.7 percent statewide, 12.7 percent for the Phoenix office, 25.2 percent for the Tucson office and 9.7 percent for the Yuma office. See a recent Arizona’s Economy article for more information on bankruptcy in Arizona.


