by George W. Hammond, Ph.D.
EBRC Director and Research Professor
According to the latest Census data, 247,459 people age one year and older moved to Arizona from another state during the previous year. These data come from the American Community Survey (ACS) five-year Public Use Microdata Sample (PUMS), measured during 2012 to 2016. During the same period, Census estimates that 159,303 people moved from another state to the Phoenix Metropolitan Statistical Area (MSA), while 34,532 people moved from another state to the Tucson MSA.
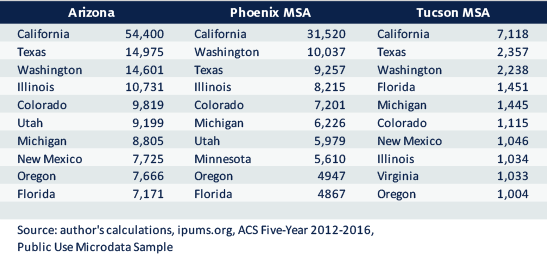
Exhibit 1 shows the top 10 states that sent migrants to Arizona during the 2012-2016 period. Note that for Arizona, the Phoenix MSA, and the Tucson MSA, the top three states are the same (although in slightly different orders): California, Texas, and Washington. For each destination, California was by far the biggest contributor, sending 54,400 migrants to Arizona, 31,520 migrants to the Phoenix MSA, and 7,118 migrants to the Tucson MSA.
Exhibit 1: Top 10 States in Gross Migration Flows Into the Region by State of Residence One Year Ago, 2012-2016

Exhibits 2 through 4 highlight the geography of gross migration inflows into Arizona, the Phoenix MSA, and the Tucson MSA. Note that all three regions draw the most migrants from western states.
These maps are interactive. Pass your cursor over the map and data will pop up. You can also click on the legend to control the states that are displayed.
Exhibit 2: Gross Migration Flows Into Arizona by State of Residence One Year Ago, 2012-2016
Exhibit 3: Gross Migration Flows Into the Phoenix MSA by State of Residence One Year Ago, 2012-2016
Exhibit 4: Gross Migration Flows Into the Tucson MSA by State of Residence One Year Ago, 2012-2016
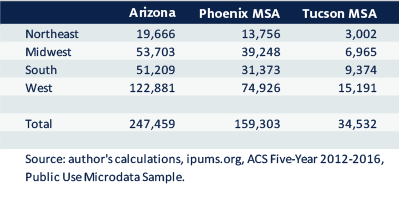
The maps above suggest that Arizona draws most of its domestic migrants from western states. Exhibit 5 gives the hard numbers, using Census regions. During the period covered by the ACS, 49.7% of migrants to the state came from the West. At 122,881, western migrants nearly matched the number of movers from the other three regions combined (124,578). For the Phoenix MSA, 47.0% of migrants came from the West and for the Tucson MSA the share was 44.0%.
Exhibit 5: Gross Migration Flows Into Region by Census Region of Residence One Year Ago, 2012-2016

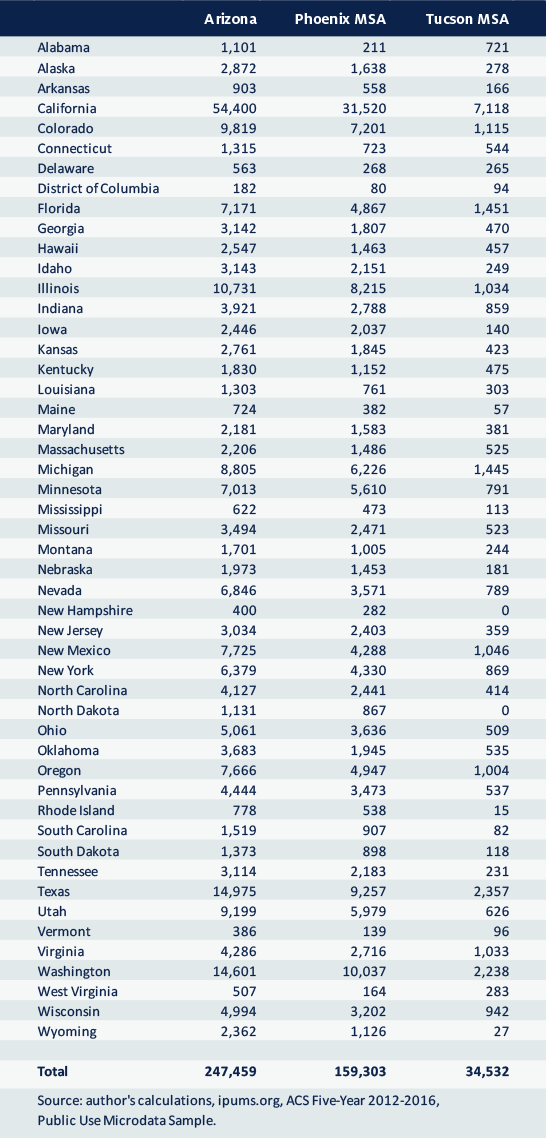
Finally, Exhibit 6 shows the migration flows from all states in table form.
Exhibit 6: Gross Migration Flows Into Region by State of Residence One Year Ago, 2012-2016


