![]() by George W. Hammond, Ph. D.
by George W. Hammond, Ph. D.
Director and Research Professor
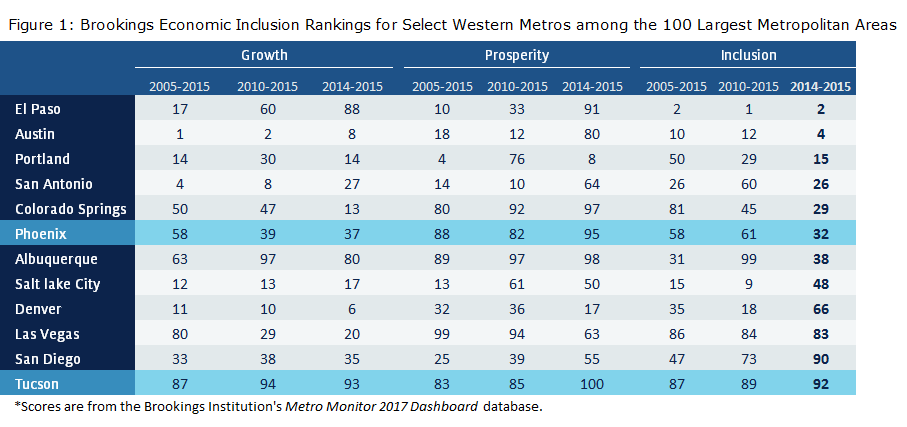
Benchmarking economic performance across metropolitan areas requires us to think about activities across many different dimensions. Certainly, overall job, population, and income growth matters, but growth rates alone do not tell us much about prosperity. On that dimension, economists generally resort to measures like per capita income, per worker Gross Domestic Product (an indicator of productivity), and per worker wages. However, these standard measures of prosperity also have limitations. In particular, they do not tell us anything about how equally income is shared across a metropolitan area’s residents. To address this dimension of economic performance, we need indicators of economic inclusion. The Brookings Institution recently constructed rankings of economic inclusion for the 100 largest metropolitan areas in the U.S. How do Arizona’s two largest metro areas stack-up?
Brookings provides rankings for three overlapping timeframes: 2005-2015 covering the Great Recession; 2010-2015, the post-recessionary recovery period; and 2014-2015, the latest year for which there are data to calculate these measures, Figure 1.
![]() To continue reading and for a summary of recent research on economic inclusion and a discussion of these rankings visit EBRC’s MAP Dashboard.
To continue reading and for a summary of recent research on economic inclusion and a discussion of these rankings visit EBRC’s MAP Dashboard.


