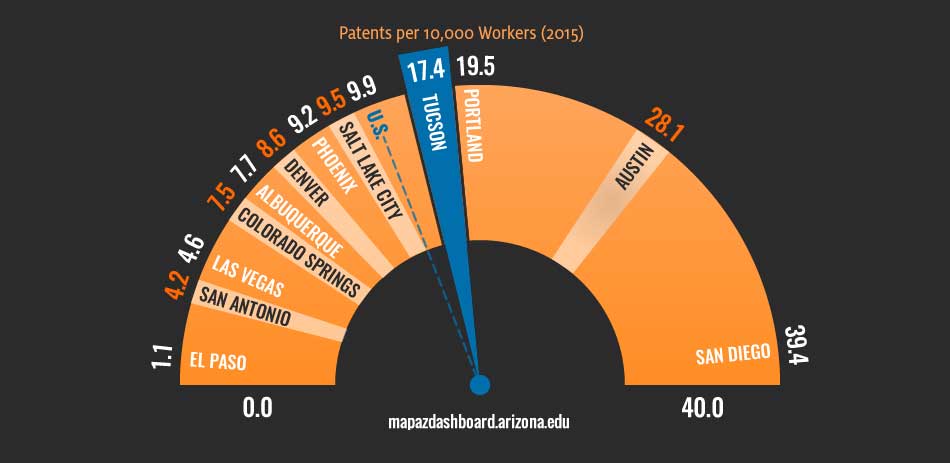
 The MAP Dashboard includes 36 indicator organized into 6 categories- Economy, Education, Health & Social Well-Being, Infrastructure, Quality of Place, and Workforce & Demographics. The indicators were initially selected based upon input received from the community and represent an area deemed important to our region. Collectively, the indicators provide a snapshot of the general state of the Southern Arizona region.
Every three years the MAP Dashboard team will revisit the indicators and invite input from the community on their relevance. This process includes evaluating existing indicators and also provides a forum for the suggestion of new indicators to consider.
The MAP Dashboard Indicator Survey is your opportunity to make your voice heard and help us define the indicators most relevant to the community. We hope you will take a few minutes to contribute to this important process.
Jennifer L. Pullen
Research Economist and MAP Dashboard Program Manager


