by Valorie Hanni Rice
Senior Specialist, Business Information
The Bureau of Labor Statistics (BLS) released the annual Employment Situation for Veterans 2014 report this spring. BLS has issued this report periodically since 1993 and annually since 2007, but has only included state-level data since 2013. Having state level data on veteran employment is a great step forward in understanding how our veterans are faring in the job market.
The employment situation data come from an annual supplement to the Current Population Survey (CPS) co-sponsored by the U.S. Department of Veteran’s Affairs and the U.S. Department of Labor’s Veteran’s Employment and Training Service. The CPS is a monthly sample survey of about 60,000 households that provides data on employment and unemployment in the U.S. Veterans are men and women who served on active duty in the U.S. Armed Forces and were not on active duty at the time of the survey.
State-Level Statistics
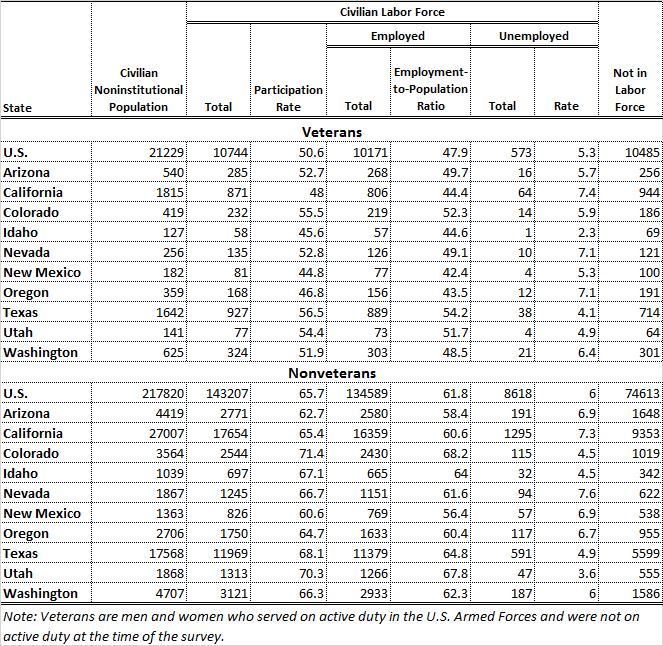
There were 268,000 veterans employed in Arizona during 2014 compared with 256,000 in 2013. The unemployment rate for veterans in Arizona was 5.7% in 2014, a decrease of 0.1% from the year before. While this was nowhere near the 1.0% unemployment drop seen in the nonveteran population during that timeframe, the change in the percent of the veteran population now in the workforce is promising. The participation rate for veterans in Arizona increased to 52.7% in 2014. This was higher than the previous year by 5.2 percentage points. While the participation rate of nonveterans in Arizona remained unchanged at 62.7%, nationally the participation rate for veterans has been steadily trending downward, hitting 50.6% in 2014 (it was 55.2% on 2007 the first year this report was issued on an annual basis).
State-level unemployment rates for veterans in 2014 ranged from 1.4% in North Dakota to 8.5% in Maryland. At 5.7%, Arizona was closer to the national figure of 5.3%. This figure is substantially lower than for nonveterans in Arizona or the U.S. overall, at 6.9% and 6.0%, respectively. Arizona’s unemployment rate for veterans remained relatively unchanged between 2013 and 2014, while there were a few states that made marked improvement. Idaho and Michigan both dropped their veteran unemployment rate by more than 4 percentage points in that time.
Among the ten western states compared in the Making Action Possible (MAP) Dashboard, Idaho had the lowest unemployment rate for veterans at 2.3% while Oregon had the highest at 7.1% in 2014. Idaho also had the greatest improvement, going from 7.2% unemployment in 2013 down to 2.3% in 2014. Texas had the highest labor force participation rate for veterans, at 56.5%. Arizona, however, had the least variance in the participation rates between veterans and nonveterans with a difference of only 10.0 percentage points. The participation rate of nonveterans is always higher, and substantially so in some cases. Nationally, the divergence was 15.1 points between veterans and nonveterans, at 50.6% and at 65.7%, respectively. See Table 1 for breakouts.
Detailed Employment Data For U.S. Veterans
The Employment Situation of Veterans report provides only basic employment figures for states; however, national data are available at a more detailed level, providing statistics by gender, race and ethnicity, service period, and industry as well as other factors.
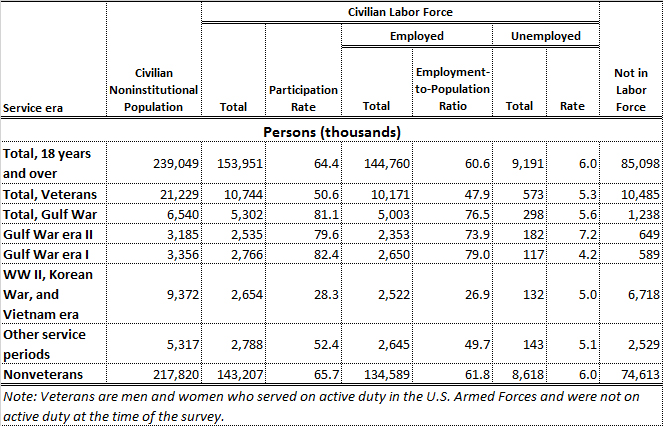
Historically, veterans have lower unemployment rates than nonveterans, and 2014 was no exception. Unemployment for U.S. veterans was 5.3% in 2014, while the rate for nonveterans was 6.0%. The rates for both veterans and nonveterans had declined from their 2013 figures of 6.6% and 7.2%, respectively. The exception to this was Gulf War-era II veterans. Their unemployment rate, at 7.2% in 2014 and 9.0% in 2013, was higher than both veterans as a whole and nonveterans.
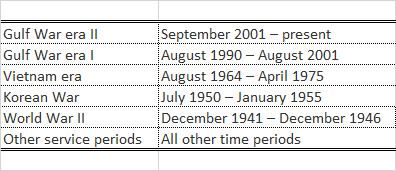
Veterans who served during World War II, Korea, and Vietnam numbered 9.4 million in 2014. The majority of veterans who served during these three periods combined are now age 65 or over (and all are over 55), yet 28.3% remain in the labor force and only 5% are unemployed. There are 6.5 million Gulf War era veterans, divided almost equally between era I and era II, and 5.3 million veterans who served in other service periods. Other service periods includes those who served on active duty between the Korean War and Vietnam era or between Vietnam and the first Gulf War. Veterans who served in more than one wartime period are classified in the most recent one. Table 2 lists the dates which define each period of service and Table 3 displays employment by period of service.
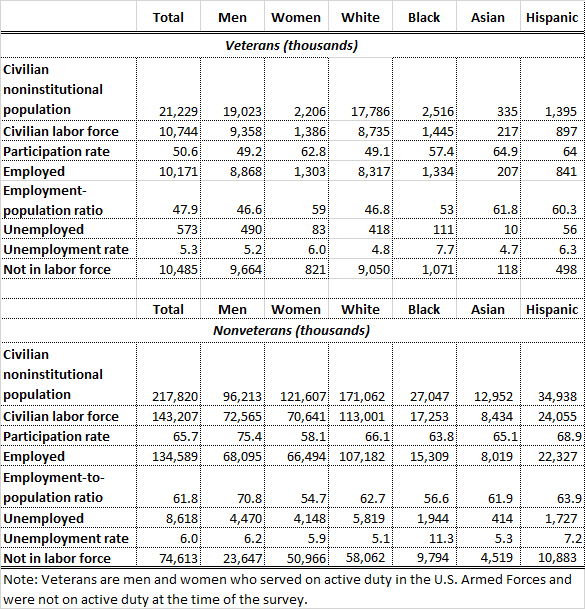
Overall, women make up 10.4% of veterans. The percent of women who are veterans varies greatly depending on the service period. Less than 4% of WWII, Korean, and Vietnam era veterans are women, while that figure goes up to 11% for other service periods, 19% for Gulf War era I, and 19.9% for Gulf War era II. Women veterans are a smaller portion of the labor force compared to men; however, their participation rate is much higher, as 62.8% of female veterans are in the labor force versus 49.2% of male veterans. Female veterans are also more likely to be in the labor force as compared to their nonveteran counterparts. The reverse is true for male veterans, as they are less likely to be in the labor force compared to men who have never served. Veterans of all races had lower rates of unemployment in 2014 than their nonveteran counterparts of the same race or ethnicity, Table 4.
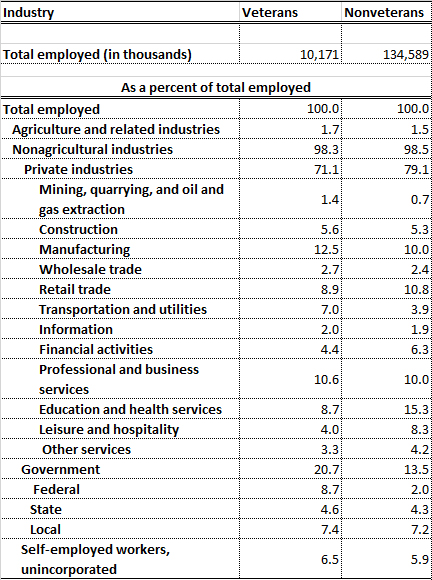
Veterans are far more likely than nonveterans to be employed in the government sector, particularly in federal government jobs. This has held true through every report since the first one in 1993. In 2014, the two other industries that employed a larger percentage of veterans than nonveterans were transportation and utilities as well as manufacturing. Industries that had fewer veterans were education and health services, leisure and hospitality, financial activities, and retail trade. Veterans were slightly more inclined to be self-employed in 2014, Table 5.
Demographic Data for Veterans in Arizona
While the Employment Situation of Veterans report does not provide detail for states, we can find demographic information on veterans in Arizona using 2013 American Community Survey five-year estimates from the Census Bureau, which is the latest data available. There are some interesting points concerning the veteran population in Arizona.
Arizona veterans are more educated that the general population. In 2013, 29.4% of Arizona veterans had a bachelor’s degree or better. This is higher than the total population for the state, at 26.9%, and even the nation, at 28.8%. It is also higher than the 26.3% reported for veterans in the U.S.
Just as Arizona has a higher percent of the population that is Hispanic or Latino than the U.S. as a whole, the state also has a higher percentage of veterans in that are Hispanic or Latino compared to the nation. The percent of Arizona’s veterans that are Hispanic or Latino is 10.6% compared to 5.6% nationally. We also have a higher percentage of American Indian and Alaska Native veterans than the nation (2.1% in AZ and 0.7% in the U.S.).
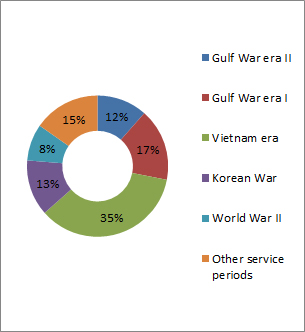
Arizona closely mirrors the U.S. in the composition of veterans by service period. The state has 1% more Korean War veterans than the nation. The largest percentage of veterans here by far served during the Vietnam era, Figure 1.
To learn more about veteran employment and demographics, you can visit the sources for this article. They are the Employment Situation of Veterans, 2014 and the 2013 American Community Survey 5-year estimates, table S2101 (Veteran Status) on American FactFinder.
Photo of American soldier with Arizona state flag courtesy of Shutterstock.


