By Valorie H. Rice and Marshall J. Vest
Recent releases from the U.S. Census Bureau show that Arizona tied with Alabama with the 6th worst poverty rate in the nation. The percentage of people living below the poverty level in 2011 was 19.0%, representing over 1.2 million Arizona residents, according to the American Community Survey’s 1-year estimates. Poverty was highest in Mississippi at 22.6%, followed by New Mexico (21.5%), Louisiana (20.4%), Arkansas (19.5%), Georgia and Kentucky (both 19.1%), and Alabama and Arizona (both 19.0%). Nationwide, 15.9% of the population was living in poverty.

Poverty rates rose over the past decade, increased significantly during the recession, and continued climbing through 2011. Nationwide, poverty increased by 3.5 percentage points over the past 11 years, from 12.4% in 2000 to 15.9%. In Arizona, the increase measured 5.1 points, rising from 13.9% to 19.0%.
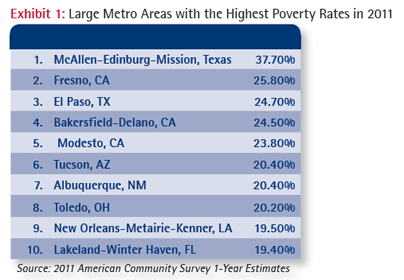
Data for metro areas and counties also are included in the tabulations. Local headlines declared that Tucson was “Among the Nation’s Poorest Regions,” and “Tucson Sixth Poorest in the Nation.” The misleading headlines failed to reveal that metro Tucson ranked 6th among metro areas with more than 500,000 population. The rankings of the largest metros showed McAllen-Edinburg-Mission, Texas with the worst concentration of poverty at 37.7%. The top 10 worst are shown in Exhibit 1.
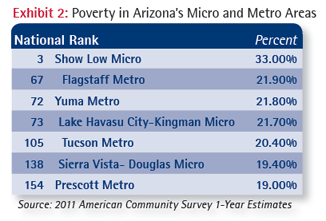
If the entire collection of the nation’s 548 micro and metro areas are included, Pima County (metro Tucson) ranks 105th. Moreover, Pima County is not the worst in Arizona. The Show Low micropolitan area is the third worst in the nation, with 33% residing in poverty. Exhibit 2 shows Arizona’s micro and metro areas (each defined as an entire county or as two counties for Metro Phoenix) and their national ranking among some 548 areas that were included in the rankings.

If the entire collection of the nation’s 548 micro and metro areas are included, Pima County (metro Tucson) ranks 105th.
Poverty in Arizona is high is due to the large portions of the population that are American Indian or Hispanic. Statewide, some 5.2% of the population is American Indian, representing some 22 tribes and 21 reservations. Poverty and unemployment on reservations are chronically high. Data for the period 2006-2010 (ACS 5-year estimates) shows poverty rates for some of Arizona’s reservations to be 39.4% for the Pascua Pueblo Yaqui Reservation and 41.2% for the Tohono O’odham Nation Reservation (both in Pima County), Fort Apache Reservation 46.7%, Gila River Indian Reservation 47.8%, Havasupai Reservation 36.6%, Hopi Reservation 35.2%, Hualapai Indian Reservation 41.2, Maricopa (Ak Chin) Indian Reservation 42.4%, San Carlos Reservation 46.0%, and Yavapai-Apache Nation Reservation 42.4%. The Hispanic population represents 30% of Arizona’s 6.4 million residents and 29.6% live in poverty.
Rates that net out the effects of these two groups significantly lower overall poverty rates. For example, without American Indians in the computation, we estimate that poverty rates would be a full percentage point lower statewide and over 10 percentage points in Show Low. Arizona would rank 15th rather than 6th. Metro Tucson would rank around 130 rather than 105. If Hispanics are excluded, Arizona’s rates would be 14.4% and its ranking 29th. The rate for metro Tucson would be 15.5% and its ranking 315th.
So, high poverty rates among American Indians and Hispanics combine to boost poverty rates and exacerbate Arizona’s rankings to other states. Programs targeting those populations are the best way to reduce poverty in Arizona.
Other often-cited reasons for high poverty in Arizona are low wage levels across many occupations, high unemployment, lack of jobs relative to the supply of labor, mediocre job skills, and poor public education results.
Measures of poverty are collected by the Census Bureau through several major household surveys and programs. The Current Population Survey Annual Social and Economic Supplement (CPS ASEC), a survey of some 100,000 addresses across the nation is the source of official national poverty estimates and includes measures of income and health insurance coverage as well. i The American Community Survey (ACS) provides estimates for smaller areas such as cities and metro areas. ii Quoting from the latter, “poverty status is determined by comparing annual income to a set of dollar values called poverty thresholds that vary by family size, number of children, and age of householder … Poverty thresholds are updated annually to allow for changes in the cost of living … They do not vary geographically.” For current and historical thresholds, visit http://www.census.gov/hhes/www/poverty/data/threshld/index.html.
To examine poverty rates and rankings by state, metropolitan area, and for Arizona in detail, download this EXCEL spreadsheet.
End notes:
i Income, Poverty, and Health Insurance Coverage in the United States: 2011, U.S. Census Bureau, September 2012, http://www.census.gov/prod/2012pubs/p60-243.pdf.
ii Poverty: 2010 and 2011, American Community Survey Briefs, U.S. Census Bureau, http://www.census.gov/prod/2012pubs/acsbr11-01.pdf.


