By George W. Hammond, Ph.D.
Director and Research Professor, EBRC
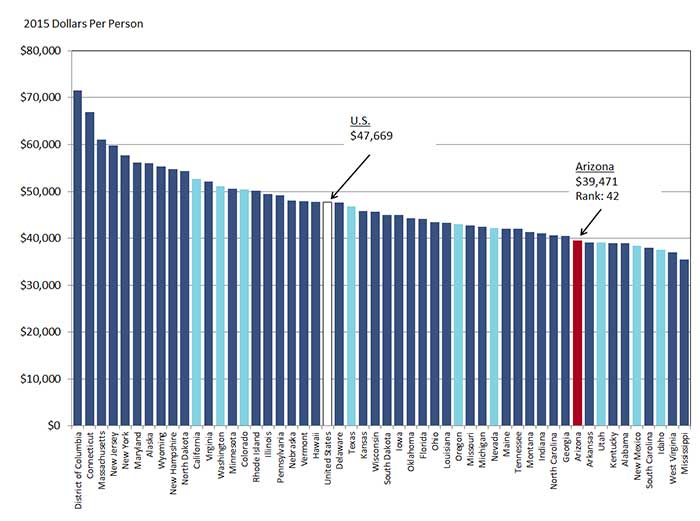
Arizona’s nominal per capita personal income hit $39,471 in 2015, according to the latest preliminary estimates from the U.S. Bureau of Economic Analysis (BEA). National per capita personal income was $47,669 last year. Arizona’s per capita personal income rose 3.2% from 2014 to 2015, before adjustment for the cost of living and inflation, a bit below the national rate of 3.5%.
Arizona’s per capita personal income was calculated using the Arizona Department of Administration population estimate for 2015, so it differs a bit from the number published by the U.S. BEA. Also, keep in mind that the data is frequently revised. If you’re reading this months after it was posted, the current data may be a bit different.
Overall, state per capita income remains well below the national average and well below per capita income in most states. As Exhibit 1 shows, Arizona’s per capita income ranked 42nd out of 50 states and the District of Columbia. Arizona’s per capita personal income was also well below that of most western states, including California, Washington, Colorado, Texas, Oregon, and Nevada. Arizona’s per capita income was above that of Utah, New Mexico, and Idaho in 2015.
Exhibit 1: Nominal Per Capita Personal Income (PCPI) in 2015 By U.S. State

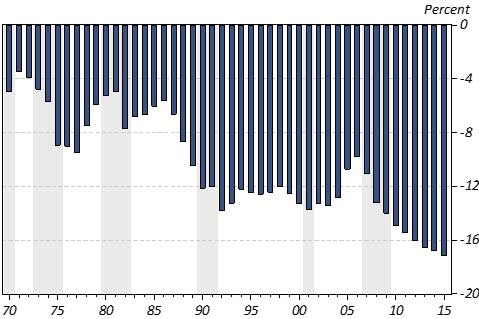
Keep in mind that Arizona’s per capita personal income gap with the nation has been growing rapidly in recent years, reflecting our sub-par growth. As Exhibit 2 shows, the gap rose steadily during the 1980s before stabilizing during the 1990s. It then fell during the economic expansion of the 2000s. The gap reached a low during this period of 9.9% in 2006. With the Great Recessing hitting the state hard, the gap increased and has now nearly doubled to 17.2%.
Exhibit 2: Arizona’s Per Capita Income Gap With The U.S.

Arizona’s income gaps with the U.S. are relatively large and have been growing rapidly. One natural question at this point is: which of the major components contributes most to the income gap? We can decompose the income gap in a straightforward way. The percentage income gap can be broken down into three major components: net earnings per capita; dividends, interest, and rent per capita; and transfers per capita. In other words, just divide each of the components of personal income by population.
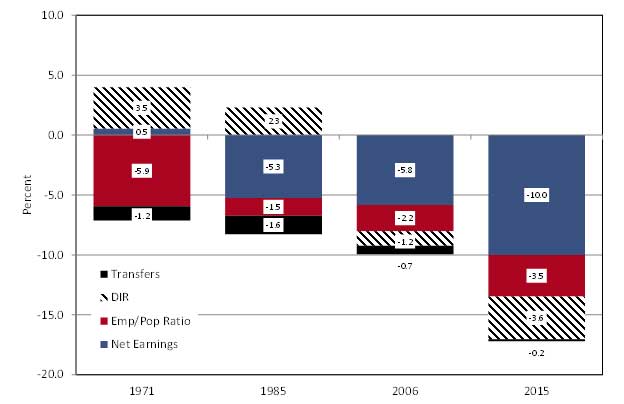
We can then further disaggregate net earnings per capita into two parts: net earnings per employment resident and the employment-population ratio. Exhibit 3 shows the results for four years during the 1970-2015 period.
Exhibit 3: Decomposing Arizona’s Per Capita Personal Income Gap With The U.S.

In 1971, the employment-population ratio made the biggest contribution to the income gap, followed by transfers per capita. In contrast, net earnings per employed resident and dividends, interest, and rent per capita were above the national average.
By 1985, however, the situation radically changed, with net earnings per employed resident accounting for 5.3% of the 6.0% income gap. That was a huge increase from 1971. The employment-population ratio made a much smaller contribution in 1985 than in 1971. Note that dividends, interest, and rent per capita remained above the national average.
By 2006, all major components contributed to the 9.9% income gap, with the biggest single contribution coming from net earnings.
Note that the situation worsens by 2015, with the per capita income gap in Arizona reaching 17.2%. The biggest contributor to the gap (again) was net earnings, followed by dividends, interest, and rent per capita, the employment-population ratio, and transfers per capita.
What has driven the rising gap and the rising contribution of net earnings per employed resident? Stay tuned for further research, but several good candidates stand out. First, changes in the employment distribution across high-low wage jobs have likely had an impact. In addition, migration/immigration trends have likely mattered as well. Finally, during this period Arizona’s educational attainment has gradually fallen behind the national average.
Forecast data for Arizona, Phoenix MSA, and Tucson MSA.
Need to know more?
Contact George Hammond about the benefits of becoming a Forecasting Project sponsor!


