

EBRC Research Staff
Current data releases as of 20 June 2024
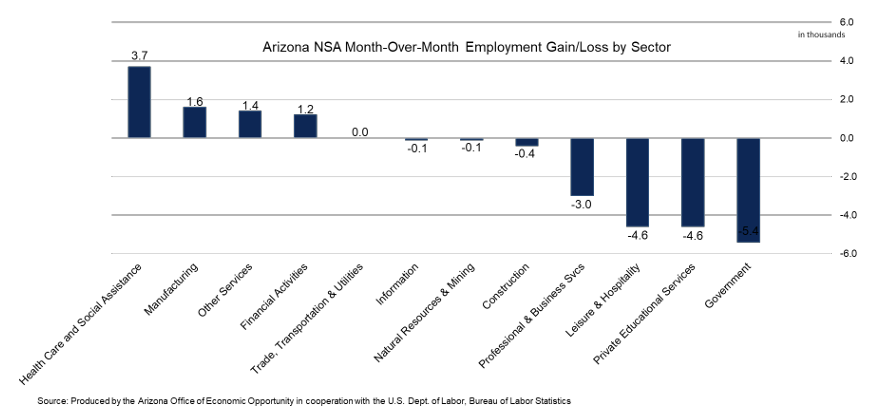
Total nonfarm employment in Arizona increased by 63,900 jobs over the year in May, with the seasonally adjusted unemployment rate decreasing to 3.4%, a record low for Arizona. The U.S. seasonally adjusted unemployment rate increased to 4.0% from 3.9% in April. Arizona’s non-seasonally adjusted total nonfarm employment decreased by 10,300 over the month, worse than the pre-pandemic average of -6,700. Employment gains were reported in health care and social assistance (3,700), manufacturing (1,600), other services (1,400), and financial activities (1,200). Losses were reported in government (-5,400), private educational services (-4,600), leisure & hospitality (-4,600), professional & business services (-3,000), construction (-400), natural resources & mining (-100), and information (-100). No net change was reported in trade, transportation, & utilities. –Delaney O’Kray-Murphy
In April, over the year metropolitan unemployment rates were higher in 305 of the 389 metropolitan areas, lower in 56 areas, and unchanged in the remaining 28. The April unemployment rate for the Tucson and Phoenix metropolitan areas came in at 2.5% and 2.3%, respectively. Yuma had the highest unemployment rate in Arizona at 8.9%, while Prescott was at 2.4%. Ames, IA; Hattiesburg, MS; and Jackson, MS, had the lowest unemployment rates at 1.6% each for the month. El Centro, CA, had the highest rate, 15.7%. The largest over-the-year increase occurred in El Centro, CA (+2.0 percentage points), and Sierra Vista-Douglas, AZ, had the largest over-the-year rate decrease (-1.2 percentage points). –Delaney O’Kray-Murphy
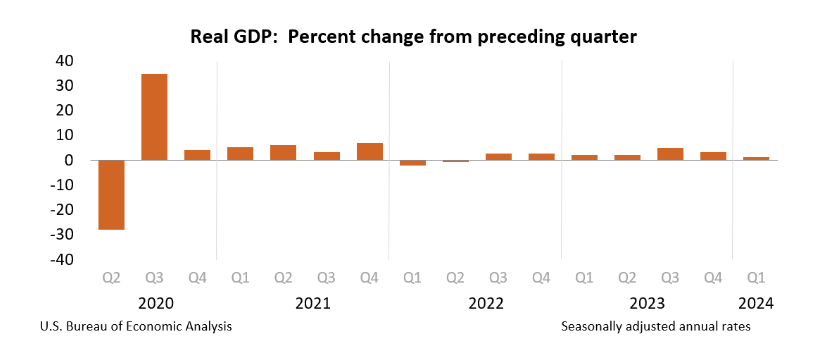
Real gross domestic product (GDP) increased at an annual rate of 1.3% in the first quarter of 2024, according to the second estimate released by the U.S. Bureau of Economic Analysis. In the advanced estimate, the increase in real GDP was 1.6%. This update primarily reflects downward revisions to consumer spending, private inventory investment, and federal government spending that were partially offset by upward revisions to state and local government spending, nonresidential fixed investment, residential fixed investment, and exports. Imports were similarly revised upwards. Current-dollar GDP increased at an annual rate of 4.3% in the first quarter, a downward revision of 0.5 percentage points. The personal consumption expenditures (PCE) price index increased 3.3%, a 0.1 percentage point downward revision. Current dollar personal income was revised downward, while disposable personal income, real disposable personal income, and personal savings were all revised upward. –Delaney O’Kray-Murphy
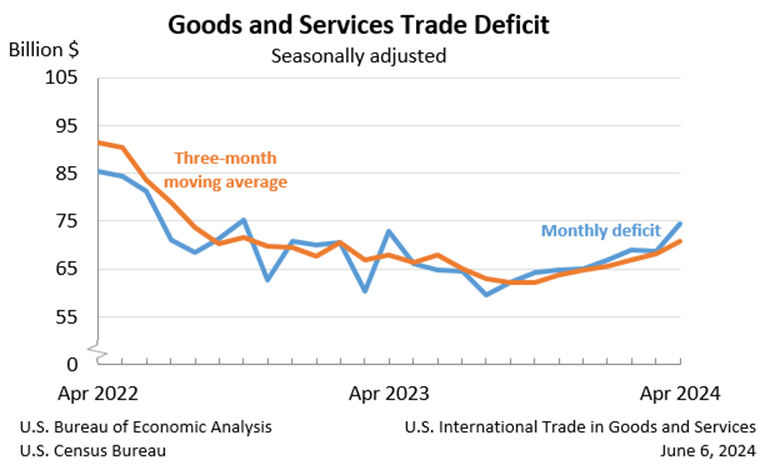
The April goods and services trade deficit was $74.6 billion, up $6.0 billion from a revised $68.6 billion in March. April exports rose $2.1 billion to $263.7 billion, and imports similarly rose $8.0 billion to $338.2 billion. The increase in the deficit reflects an increase in the goods deficit of $5.9 billion to $99.2 billion and a decrease in the services surplus of $0.1 billion to $24.7 billion. Over the year, the goods and services deficit increased $5.5 billion, or 2.0%, with exports rising 3.2% and imports increasing 2.9%. The largest surpluses, in billions, occurred with South and Central America ($4.6), Netherlands ($4.4), and Hong Kong ($1.5), while the greatest deficits were with the European Union ($22.5), China ($22.1), and Mexico ($12.8). –Delaney O’Kray-Murphy
The U.S. unemployment rate changed little in May at 4.0% while total nonfarm payroll employment increased by 272,000, according to the Bureau of Labor Statistics June 7th employment summary. The unemployment rates for major worker groups saw little or no change in May, with teenagers (12.3%) and Blacks (6.1%) having the highest unemployment rates and Asians (3.1%) and adult women (3.4%) having the lowest. Total nonfarm payroll employment increased by 272,000 over the month in May, higher than the average monthly gain of 232,000 over the last 12 months. Employment trended up in health care (68,000), government (43,000), leisure and hospitality (42,000), and professional, scientific, and technical services (32,000). Social assistance (15,000) and retail trade (13,000) employment also rose, and employment in other major industries showed little or no change. –Delaney O’Kray-Murphy
Consumer prices were unchanged in May on a seasonally adjusted basis. The monthly change in the Consumer Price Index for All Urban Consumers had ranged from 0.3% to 0.4% since January. The U.S. Bureau of Labor Statistics report indicated that gasoline prices fell while shelter increased over the month. Food away from home rose 0.4% over the month while food at home was flat. The index for all items less food and energy rose 0.2%. The annual inflation rate for May was 3.3%, down from 3.4% in April. The all items less food and energy index increased by 3.4% over the last 12 months. –Valorie Rice
Phoenix house prices rose at a slower pace than the nation in March, with a year-over-year gain of 4.9% compared to 6.5% reported for the national home price index. San Diego led the 20 cities reported in the S&P CoreLogic Case-Shiller indices with an 11.1% increase over the year. New York and Cleveland, with increases of 9.2% and 8.8%, respectively, followed closely behind San Diego. Denver had the smallest year-over-year growth in house prices for March at 2.1% and Portland was close to that at 2.2%. Price changes between February and March increased for all 20 cities ranging from 0.5% in Phoenix and Tampa to 2.7% in Seattle. The month-over-month price change was 1.3% nationally and 1.6% for the 20-city composite. –Valorie Rice
House prices increased in all fifty states between the first quarter of 2023 and the first quarter of 2024 based on the Federal Housing Finance Agency (FHFA) House Price Index. Nationally, house prices grew 6.6% over the year in the first quarter of 2024 and have experienced positive annual appreciation every quarter since the beginning of 2012. States in New England and the Middle Atlantic had the highest appreciation with Vermont posting a one-year gain of 12.8% followed by New Jersey at 11.6% and New York at 10.9%. Arizona was much further down the list with a one-year gain of 5.0%, ranking it 37th out of all states. Louisiana and Mississippi had the lowest appreciation among all states at 2.2% and 2.7%, respectively. Metropolitan area data are available with the all-transactions index which includes prices reflecting both purchase and refinance mortgages. Changes in Arizona metropolitan area prices over the year ending the first quarter of 2024 were 8.9% in Yuma, 6.3% in Phoenix, 5.6% in Flagstaff, 4.5% in Sierra Vista-Douglas, 4.4% in Prescott Valley-Prescott, 4.2% in Tucson, and 0.1% in Lake Havasu City-Kingman. Based on the all-transactions index, annual appreciation in the first quarter was 6.3% in the U.S. and 5.3% in Arizona. –Valorie Rice
FHFA All Transactions House Price Index
The April 2024 release of the Job Openings and Labor Turnover (JOLTS) report stated that the number of job openings in the U.S. was 8.1 million, while the job openings rate was unchanged at 4.8%. The industry that saw the largest increase was private educational services (+50,000). The industry that saw the largest decrease was health care and social assistance (-204,000). The number of hires nationally was 5.6 million, with a rate of 3.6% for April, unchanged from March. The number of total separations in the nation was 5.4 million, with a rate of 3.4%. The number of quits changed little at 3.5 million with a rate of 2.2%, which has held for the last six months. The number of layoffs and discharges changed little at 1.5 million with a rate of 1.0%. –Alex Jaeger
According to the June 18th State Job Openings and Labor Turnover (JOLTS) report, the job openings rates decreased in 12 states, increased in three states, and were little changed in all other states. Arizona was one of the top states to see an increase in job opening rates with a one percentage point change. The job openings rates for Arizona were 5.4% for April, 4.4% for March, and 5.4% for February. The number of job openings decreased in 13 states, increased in four states, and was little changed in all other states. The largest decrease in the number of job openings was seen in California (-81,000). The largest increase in the number of job openings was seen in Virginia (+46,000). Hire rates decreased in two states, increased in four states, and little changed in all other states. Idaho saw the largest increase with +1.0 percentage point. The hire rates for Arizona were 3.8% for April, 3.4% for March, and 3.7% for February. The number of hires decreased in two states, increased in five states, and little changed in all others. New Jersey (-36,000) and Massachusetts (-23,000) saw the largest decreases in levels of hiring. The number of layoffs and discharges decreased in 12 states, increased in three states, and were little changed in all other states. The largest increase was seen in California (+39,000). Nationally, the layoffs and discharges rates and total separations rates were little changed. –Alex Jaeger
The May Producer Price Index (PPI) for final demand decreased by 0.2% on a seasonally adjusted basis after increasing 0.5% in April. Final demand goods declined by 0.8% in May while final demand services was unchanged. The drop in goods prices could mostly be attributed to a decline in energy prices, more specifically gasoline, according to the U.S. Bureau of Labor Statistics June 13 PPI release. The 12-month change in the index for final demand was 2.2% and final demand less foods, energy, and trade increased even more at 3.2% on an unadjusted basis.


