

By Valorie Rice,
EBRC Senior Business Information Specialist
Comments and a correction: Please note, this article, originally published September 19, 2014, has been slightly revised (October 15, 2014). Upon further review, there are compatibility issues with relating the 2012 data with 2002 for the state of Arizona due to an under-count in reservation areas for 2002. Therefore, we have revised the article to remove portions that compared back to 2002.
The National Agricultural Statistics Service continues to improve the accuracy and response to the Census of Agriculture, and improvements in methodology can make it challenging to compare between prior census years. Regardless, the agricultural census provides us the best picture we have of the state of agriculture in the nation currently.
The U.S. Department of Agriculture released 2012 Census of Agriculture in May. Much like the economic census conducted by the Census Bureau, the U.S. Department of Agriculture (USDA) produces an agricultural census every five years (those ending on a 2 or 7), allowing us a look at the demographics, economics, and production practices of our nation’s farms. The Census Bureau conducted the Census of Agriculture from 1840 to 1996 at which time the responsibility was transferred to the National Agricultural Statistics Service within the USDA.
Highlights
There were 33,613 farmers in Arizona operating 20,005 farms on 26.2 million acres in 2012. While the number of acres being farmed in Arizona has remained essentially unchanged during this time frame, both the number of farmers and the number farms in Arizona grew by a startling 28% between 2007 and 2012 while the total number of farmers in the U.S. actually declined by 3% and the number of farms decreased 4%. This interesting result is driven by the fact that average farm size in Arizona has been shrinking. The average farm in Arizona was 1,670 acres in 2007, and by 2012 this figure had declined to 1,312 acres. Farms and ranches in most western states are typically much larger when compared to the nation. The average farm size in the U.S. in 2012 was 424 acres. So when compared to the nation, farm size in Arizona is still relatively large, in fact, Arizona is 6th in terms of average farm size, behind only Wyoming, Montana, New Mexico, Nevada and South Dakota.
Results for Arizona also differ remarkably from national trends in terms of the demographics of farm ownership. Nearly 40% of farms in Arizona now have a principal operator who is female compared to 14% nationally. Also, the percentage of farms in Arizona headed by American Indian or Alaska Natives is vastly larger than the national figure – while only 2% of farms in the U.S. have a principal operator who is American Indian, this group comprises 56% of farm operators in Arizona.
Apache County has the largest number of farms in the state with 5,591 farms, followed by Navajo (3,846), Maricopa (2,479) and Coconino (2,239). Taken together, the counties of Apache, Navajo and Coconino make up just over half of the number of farms in the state and consist primarily of small farms. Indeed, more than 90% of the farms in Coconino and Navajo counties are less than 50 acres. The counties with the highest percentage of farms or ranches over 1,000 acres are Cochise and La Paz. Land in farms includes cropland, pasture, grazing, woodland and other (Table 1).
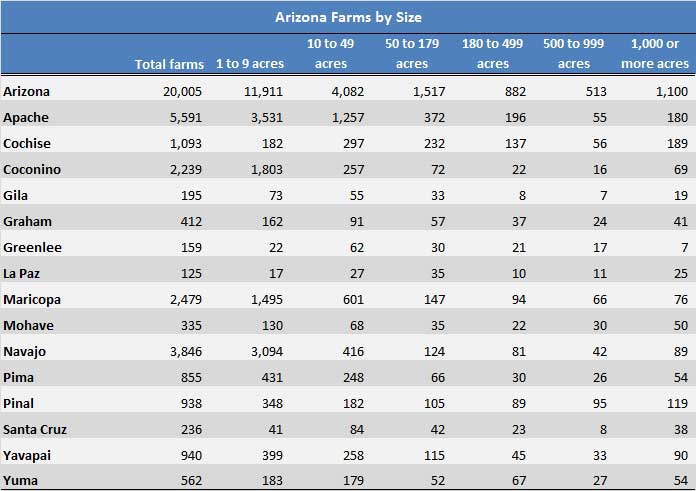
Table 1: Arizona Farms by Size
2012 Census of Agriculture
Economics – Production, Sales, and Workforce
Cattle, cotton and citrus have traditionally been important products for Arizona, making up three of the “Five C’s” of Arizona’s economy. They are still important, but now so are cantaloupe and cauliflower. The vegetables, melons, potatoes and sweet potatoes category of products rank highest in the state based on market value of agricultural products sold for 2012. Rounding out the top five products for the state: 2) milk from cows, 3) cattle and calves, 4) other crops and hay, and 5) nursery, greenhouse, floriculture, and sod. The top five commodities for the U.S. by market value are 1) grains, oilseeds, dry bean, and dry peas, 2) cattle and calves, 3) poultry and eggs, 4) milk from cows, and 5) fruits, tree nuts, and berries (Table 2).
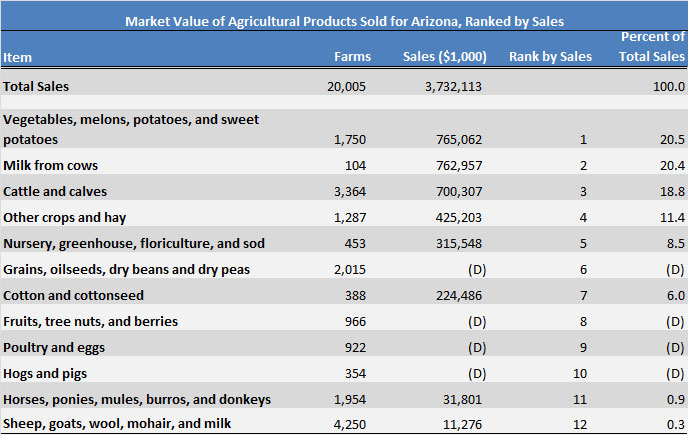
Table 2: Market Value of Agricultural Products Sold for Arizona, Ranked by Sales
2012 Census of Agriculture
The county in Arizona with the highest total market value of agricultural products sold in the state is Maricopa followed closely by Yuma and Pinal. These three counties together comprise 78% of the $3,732,113,000 total value of agricultural products sold in the state. Milk from cows is the top commodity group for Maricopa by value of sales while for Pinal it is cattle and calves. Yuma County has the largest value of sales for vegetables as well as the most acreage in vegetable crops. In fact, Yuma ranks fourth out of all U.S. counties producing vegetable crops and second for lettuce crops when comparing both acreage and value of sales (Table 3).
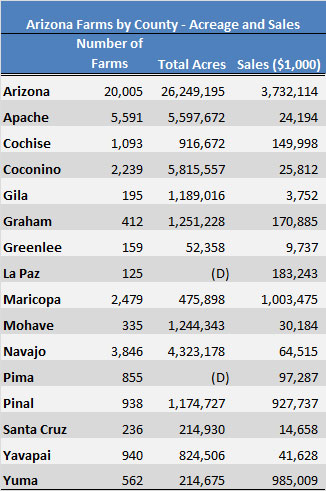
Table 3: Arizona Farms by County – Acreage and Sales
2012 Census of Agriculture
Of the $3,732,113,000 in farm sales for Arizona in 2012, 56% is from crop sales and 44% from livestock. While the market value of products sold increased for the state as a whole by 15% between 2007 and 2012, the average per farm declined from $206,852 in 2007 to $186,559 in 2012. Once production expenses are factored in, the average net cash income per farm is $30,012 in Arizona, down from $37,344 in 2007.
Farm workers make up a miniscule percentage of all U.S. employment and are not counted in most employment reports. Farm labor comprises total hired farm workers, including paid family members. Employment data are broken out by the number of days worked. There were 2,736,417 hired farm workers in the U.S. in 2012, the majority of which were found in California, Washington, and Texas. Arizona has 29,245 hired farm workers, 45% of which work fewer than 150 days in the year.
Demographics – Who are the Farmers?
The number of farmers was declined by 3% nationally between 2007 and 2012, while in Arizona the number grew by 28% in the same time frame. This result is most likely driven by rising number of smaller farms. Along with the rise in the number of farmers, the demographic characteristics of farm operators in Arizona diverge from national trends. The average age of the principal operator on farms in Arizona is 61, three years older than the U.S. average of 58 and they have been in the farming business an average of 27 years compared to 25 years nationally. Aside from being more experienced, farmers in Arizona are more likely to be female and American Indian. Nearly 40% of farms in Arizona have a principal operator who was female compared to 14% nationally. The percentage of farms in Arizona headed by American Indian or Alaska Natives is vastly larger than the nation – while only 2% of farms in the U.S. have a principal operator who are American Indian, 56% of farms in Arizona are have operators from this demographic. The number of Hispanics as principal operators of farms in Arizona is 4%, similar to the 3% found nationally (Table 4).
Arizona followed the same pattern as the nation where farming is now a primary occupation for the person chiefly responsible for the operation of a farm or ranch business. Interestingly, the number of farm operators listing farming as their primary occupation, meaning the number of primary operators who spend 50% or more of their work time farming or ranching, rose between 2007 and 2012 for both Arizona and the U.S. The percent of operators who report having no days of work off the farm for Arizona went from 43% in 2007 to 46% in 2012. Many times, farms do not produce enough income for households to depend solely on earnings from farm operation, so fewer farmers and ranchers having to work off the farm may speak to an increased ability on the part of operators to make a living at farming.
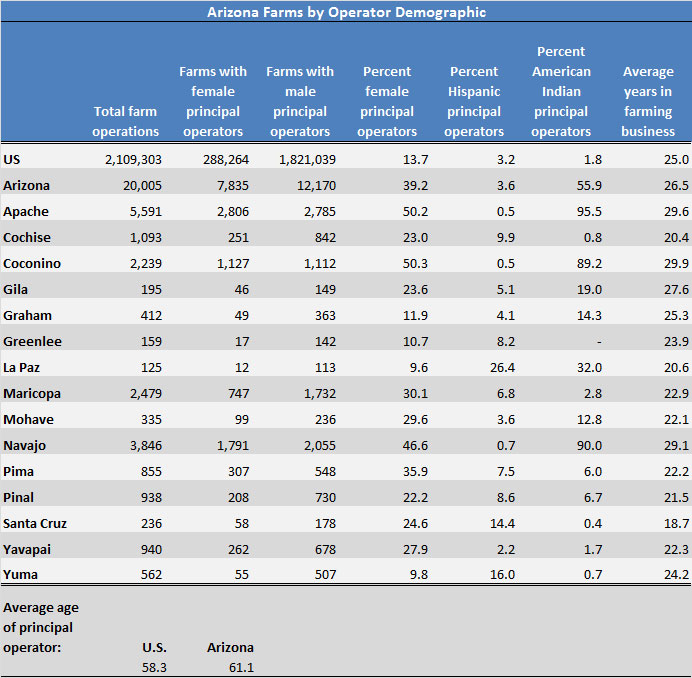
Table 4: Arizona Farms by Operator Demographic
2012 Census of Agriculture
Trends and Practices
The 2012 Census of Agriculture examines many varied aspects of farming and ranching. Here are a few of the interesting trends and practices which emerged. The use of renewable energy producing systems in 2012 is up by 144% nationally compared to 2007. Arizona has 794 farms with renewable energy producing systems, 739 of which report having solar panels. Other renewable energy systems Arizona farmers report using are wind turbines (135), biodiesel (17), and other (38).
When it comes to computer use by farmers and ranchers, Arizona is the least wired state. Only 45% of farms in the state have internet access compared to 70% nationwide. Alaska has the smallest amount of farms but the highest percentage of internet access at 85%, a full 40 percentage points higher than Arizona. Of the Arizona farms which have internet, most use DSL or satellite services.
In 2012, 6% of farms in Arizona sold products directly to individuals for human consumption, by means of farmers markets and pick-your-own sites and the like. Two percent marketed products directly to retailers. The number of farms producing and selling value-added products (such as fruit jams, cider, and wine) increased by 32% rising from 326 in 2007 to 429 in 2012.
The availability of organic produce has become increasingly important to the consumer in recent years. In 2012, Arizona had 75 farms producing commodities in accordance with the USDA’s National Organic Program, most of these farms are found in Pima and Maricopa counties. These farms had total organic product sales of $54,503,000 in 2012, accounting for almost 2% of total farm sales for the state. California is the state with the largest number of organic farms, with 3,008, out of the U.S. total of 14,326. The state with the highest percentage of total sales coming from certified or exempt organically produced commodities is New Hampshire, with 8%. California is seventh with 3% and Arizona is in ninth place. Organically grown commodities account for less than one percent of agricultural commodities nationally. Unfortunately, the methodology for reporting organic commodity production in 2012 is different than it was in 2007, and so the results are not directly comparable. This makes it difficult to estimate growth in this market since the 2007 Census of Agriculture.
Photo of young woman farmer with pick-up truck courtesy Shutterstock.


